This is the final post in our three part series on shape detection and analysis.
Previously, we learned how to:
Today we are going to perform both shape detection and color labeling on objects in images.
At this point, we understand that regions of an image can be characterized by both color histograms and by basic color channel statistics such as mean and standard deviation.
But while we can compute these various statistics, they cannot give us an actual label such as “red”, “green”, “blue”, or “black” that tags a region as containing a specific color.
…or can they?
In this blog post, I’ll detail how we can leverage the L*a*b* color space along with the Euclidean distance to tag, label, and determine the color of objects in images using Python and OpenCV.
Determining object color with OpenCV
Before we dive into any code, let’s briefly review our project structure:
|--- pyimagesearch | |--- __init__.py | |--- colorlabeler.py | |--- shapedetector.py |--- detect_color.py |--- example_shapes.png
Notice how we are reusing the shapedetector.py
and ShapeDetector
class from our previous blog post. We’ll also create a new file, colorlabeler.py
, that will be used to tag image regions with a text label of a color.
Finally, the detect_color.py
driver script will be used to glue all the pieces together.
Before you continue working through this post, make sure that you have the imutils Python package installed on your system:
$ pip install imutils
We’ll be using various functions inside this library through the remainder of the lesson.
Labeling colors in images
The first step in this project is to create a Python class that can be used to label shapes in an image with their associated color.
To do this, let’s define a class named ColorLabeler
in the colorlabeler.py
file:
# import the necessary packages from scipy.spatial import distance as dist from collections import OrderedDict import numpy as np import cv2 class ColorLabeler: def __init__(self): # initialize the colors dictionary, containing the color # name as the key and the RGB tuple as the value colors = OrderedDict({ "red": (255, 0, 0), "green": (0, 255, 0), "blue": (0, 0, 255)}) # allocate memory for the L*a*b* image, then initialize # the color names list self.lab = np.zeros((len(colors), 1, 3), dtype="uint8") self.colorNames = [] # loop over the colors dictionary for (i, (name, rgb)) in enumerate(colors.items()): # update the L*a*b* array and the color names list self.lab[i] = rgb self.colorNames.append(name) # convert the L*a*b* array from the RGB color space # to L*a*b* self.lab = cv2.cvtColor(self.lab, cv2.COLOR_RGB2LAB)
Line 2-5 imports our required Python packages while Line 7 defines the ColorLabeler
class.
We then dive into the constructor on Line 8. To start, we need to initialize a colors dictionary (Lines 11-14) that specifies the mapping of the color name (the key to the dictionary) to the RGB tuple (the value of the dictionary).
From there, we allocate memory for a NumPy array to store these colors, followed by initializing the list of color names (Lines 18 and 19).
The next step is to loop over the colors
dictionary, followed by updating the NumPy array and the colorNames
list, respectively (Lines 22-25).
Finally, we convert the NumPy “image” from the RGB color space to the L*a*b* color space.
So why are we using the L*a*b* color space rather than RGB or HSV?
Well, in order to actually label and tag regions of an image as containing a certain color, we’ll be computing the Euclidean distance between our dataset of known colors (i.e., the lab
array) and the averages of a particular image region.
The known color that minimizes the Euclidean distance will be chosen as the color identification.
And unlike HSV and RGB color spaces, the Euclidean distance between L*a*b* colors has actual perceptual meaning — hence we’ll be using it in the remainder of this post.
The next step is to define the label
method:
def label(self, image, c): # construct a mask for the contour, then compute the # average L*a*b* value for the masked region mask = np.zeros(image.shape[:2], dtype="uint8") cv2.drawContours(mask, [c], -1, 255, -1) mask = cv2.erode(mask, None, iterations=2) mean = cv2.mean(image, mask=mask)[:3] # initialize the minimum distance found thus far minDist = (np.inf, None) # loop over the known L*a*b* color values for (i, row) in enumerate(self.lab): # compute the distance between the current L*a*b* # color value and the mean of the image d = dist.euclidean(row[0], mean) # if the distance is smaller than the current distance, # then update the bookkeeping variable if d < minDist[0]: minDist = (d, i) # return the name of the color with the smallest distance return self.colorNames[minDist[1]]
The label
method requires two arguments: the L*a*b* image
containing the shape we want to compute color channel statistics for, followed by c
, the contour region of the image
we are interested in.
Lines 34 and 35 construct a mask for contour region, an example of which we can see below:
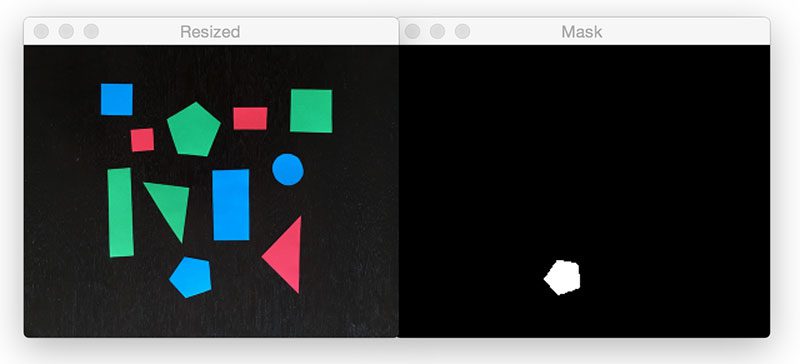
Notice how the foreground region of the mask
is set to white, while the background is set to black. We’ll only perform computations within the masked (white) region of the image.
We also erode the mask slightly to ensure statistics are only being computed for the masked region and that no background is accidentally included (due to a non-perfect segmentation of the shape from the original image, for instance).
Line 37 computes the mean (i.e., average) for each of the L*, a*, and *b* channels of the image
for only the mask
‘ed region.
Finally, Lines 43-51 handles looping over each row of the lab
array, computing the Euclidean distance between each known color and the average color, and then returning the name of the color with the smallest Euclidean distance.
Defining the color labeling and shape detection process
Now that we have defined our ColorLabeler
, let’s create the detect_color.py
driver script. Inside this script we’ll be combining both our ShapeDetector
class from last week and the ColorLabeler
from today’s post.
Let’s go ahead and get started:
# import the necessary packages from pyimagesearch.shapedetector import ShapeDetector from pyimagesearch.colorlabeler import ColorLabeler import argparse import imutils import cv2 # construct the argument parse and parse the arguments ap = argparse.ArgumentParser() ap.add_argument("-i", "--image", required=True, help="path to the input image") args = vars(ap.parse_args())
Lines 2-6 import our required Python packages — notice how we are importing both our ShapeDetector
and ColorLabeler
.
Lines 9-12 then parse our command line arguments. Like the other two posts in this series, we only need a single argument: the --image
path where the image we want to process lives on disk.
Next up, we can load the image and process it:
# load the image and resize it to a smaller factor so that # the shapes can be approximated better image = cv2.imread(args["image"]) resized = imutils.resize(image, width=300) ratio = image.shape[0] / float(resized.shape[0]) # blur the resized image slightly, then convert it to both # grayscale and the L*a*b* color spaces blurred = cv2.GaussianBlur(resized, (5, 5), 0) gray = cv2.cvtColor(blurred, cv2.COLOR_BGR2GRAY) lab = cv2.cvtColor(blurred, cv2.COLOR_BGR2LAB) thresh = cv2.threshold(gray, 60, 255, cv2.THRESH_BINARY)[1] # find contours in the thresholded image cnts = cv2.findContours(thresh.copy(), cv2.RETR_EXTERNAL, cv2.CHAIN_APPROX_SIMPLE) cnts = imutils.grab_contours(cnts) # initialize the shape detector and color labeler sd = ShapeDetector() cl = ColorLabeler()
Lines 16-18 handle loading the image from disk and then creating a resized
version of it, keeping track of the ratio
of the original height to the resized height. We resize the image so that our contour approximation is more accurate for shape identification. Furthermore, the smaller the image is, the less data there is to process, thus our code will execute faster.
Lines 22-25 apply Gaussian smoothing to our resized image, converting to grayscale and L*a*b*, and finally thresholding to reveal the shapes in the image:
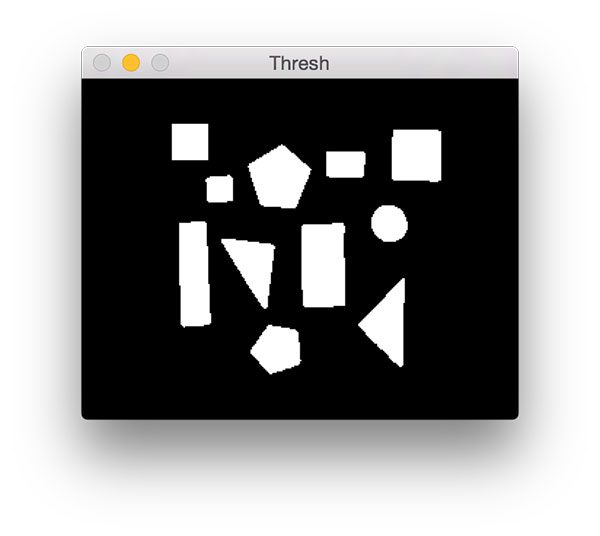
We find the contours (i.e., outlines) of the shapes on Lines 29-30, taking care of to grab the appropriate tuple value of cnts
based on our OpenCV version.
We are now ready to detect both the shape and color of each object in the image:
# loop over the contours for c in cnts: # compute the center of the contour M = cv2.moments(c) cX = int((M["m10"] / M["m00"]) * ratio) cY = int((M["m01"] / M["m00"]) * ratio) # detect the shape of the contour and label the color shape = sd.detect(c) color = cl.label(lab, c) # multiply the contour (x, y)-coordinates by the resize ratio, # then draw the contours and the name of the shape and labeled # color on the image c = c.astype("float") c *= ratio c = c.astype("int") text = "{} {}".format(color, shape) cv2.drawContours(image, [c], -1, (0, 255, 0), 2) cv2.putText(image, text, (cX, cY), cv2.FONT_HERSHEY_SIMPLEX, 0.5, (255, 255, 255), 2) # show the output image cv2.imshow("Image", image) cv2.waitKey(0)
We start looping over each of the contours on Line 38, while Lines 40-42 compute the center of the shape.
Using the contour, we can then detect the shape
of the object, followed by determining its color
on Lines 45 and 46.
Finally, Lines 51-57 handle drawing the outline of the current shape, followed by the color + text label on the output image.
Lines 60 and 61 display the results to our screen.
Color labeling results
To run our shape detector + color labeler, just download the source code to the post using the form at the bottom of this tutorial and execute the following command:
$ python detect_color.py --image example_shapes.png
As you can see from the GIF above, each object has been correctly identified both in terms of shape and in terms of color.
Limitations
One of the primary drawbacks to using the method presented in this post to label colors is that due to lighting conditions, along with various hues and saturations, colors rarely look like pure red, green, blue, etc.
You can often identify small sets of colors using the L*a*b* color space and the Euclidean distance, but for larger color palettes, this method will likely return incorrect results depending on the complexity of your images.
So, that being said, how can we more reliably label colors in images?
Perhaps there is a way to “learn” what colors “look like” in the real-world.
Indeed, there is.
And that’s exactly what I’ll be discussing in a future blog post.
What's next? We recommend PyImageSearch University.
86+ total classes • 115+ hours hours of on-demand code walkthrough videos • Last updated: February 2025
★★★★★ 4.84 (128 Ratings) • 16,000+ Students Enrolled
I strongly believe that if you had the right teacher you could master computer vision and deep learning.
Do you think learning computer vision and deep learning has to be time-consuming, overwhelming, and complicated? Or has to involve complex mathematics and equations? Or requires a degree in computer science?
That’s not the case.
All you need to master computer vision and deep learning is for someone to explain things to you in simple, intuitive terms. And that’s exactly what I do. My mission is to change education and how complex Artificial Intelligence topics are taught.
If you're serious about learning computer vision, your next stop should be PyImageSearch University, the most comprehensive computer vision, deep learning, and OpenCV course online today. Here you’ll learn how to successfully and confidently apply computer vision to your work, research, and projects. Join me in computer vision mastery.
Inside PyImageSearch University you'll find:
- ✓ 86+ courses on essential computer vision, deep learning, and OpenCV topics
- ✓ 86 Certificates of Completion
- ✓ 115+ hours hours of on-demand video
- ✓ Brand new courses released regularly, ensuring you can keep up with state-of-the-art techniques
- ✓ Pre-configured Jupyter Notebooks in Google Colab
- ✓ Run all code examples in your web browser — works on Windows, macOS, and Linux (no dev environment configuration required!)
- ✓ Access to centralized code repos for all 540+ tutorials on PyImageSearch
- ✓ Easy one-click downloads for code, datasets, pre-trained models, etc.
- ✓ Access on mobile, laptop, desktop, etc.
Summary
Today is the final post in our three part series on shape detection and analysis.
We started by learning how to compute the center of a contour using OpenCV. Last week we learned how to utilize contour approximation to detect shapes in images. And finally, today we combined our shape detection algorithm with a color labeler, used to tag shapes a specific color name.
While this method works for small color sets in semi-controlled lighting conditions, it will likely not work for larger color palettes in less controlled environments. As I hinted at in the “Limitations” section of this post, there is actually a way for us to “learn” what colors “look like” in the real-world. I’ll save the discussion of this method for a future blog post.
So, what did you think of this series of blog posts? Be sure to let me know in the comments section.
And be sure to signup for the PyImageSearch Newsletter using the form below to be notified when new posts go live!
Download the Source Code and FREE 17-page Resource Guide
Enter your email address below to get a .zip of the code and a FREE 17-page Resource Guide on Computer Vision, OpenCV, and Deep Learning. Inside you'll find my hand-picked tutorials, books, courses, and libraries to help you master CV and DL!
I’ve worked with RGB and HSV quite a bit, but I never used LAB. Knowing now that it makes Euclidean distance meaningful in perceptual space means that I’ll stop trying to shoehorn RGB or HSV Euclidean distance into tasks for which they’re ill suited. Thanks!
I’m glad the post helped David! 🙂
Hi,i need code which takes image as input,and displays objects color,shape,which are inside image .Please help.
Hi Shankar — the code in this blog post discusses how to detect shapes and then determine what shape they are and its color. How is your project different from the blog post?
Hi Adrian,
As always nice work,
but i have a question will this be applicable to other colors eg. (orange) and what if the color is a bit vague orange, will it still detect it?
Regards,
You’ll need to define what exactly “orange” is in terms of the L*a*b* color space, but yes, this approach can still work for detecting orange colors.
How would I go about defining colours such as orange, yellow, brown etc in code such as this?
Please see my reply to “RAVIVARMAN” above.
Can’t find your replay. Pls post it again.
Hey Adrian,
Is is possible to run this script (python + openCV) on a web server?
The idea is to upload an image through web browser and get the result image as response.
I’ve been able to run python on it, but didn’t get openCV up.
Cheers D
Absolutely — just take a look at this blog post.
Hi Adrian,
I’ve been working for detecting seven colors and I want to do it in less controlled environments. I’ve tried my best, but I can’t find a solution. Then I found your blog post. I’m very looking forward to your method to solve this problem. Thanks for sharing!
Hi Adrian,
I have been working on my school project on detecting object and color concurrently using live feed video, would that be fine for you to guide me through to get my code done? Your help will be much appreciated.
I actually cover how to detect and track an object based on its color inside Practical Python and OpenCV. I would suggest starting there.
Is it still beneficiary to use L*A*B* colors space, as opposed to HSV, for detecting objects in the real world? (Where lighting and shadows play a huge role)
Also, if I should use HSV how can I approximate the Euclidean distance from HSV? Should i just focus on the Hue and Saturation Value and try to find the shortest distance between them??
Thanks
In general, yes, the L*a*b* color space is better at handling lighting condition variations. As for HSV and the Euclidean distance, that’s entirely based on what you are trying to accomplish. Since I don’t know that I would suggest experimenting with and without the Value component in your Euclidean distance and look at the results.
hey, i just had a minor doubt. You used cvtColor command to convert BGR and RGB to LAB. But, as mentioned in the official documentation, it actually returns 2.55*L, a+128, b+128 and not Lab. Does the euclidean distance have meaning in this space, or else, shouldnt the values returned by this command be converted to get the actual Lab values?
Yes, these values (and the associated Euclidean distance) still have perceptual meaning.
Hi,
Thanks for the code.
I just trying to see the leaf color like whether is green or brown or yellow.
I tried this code i am getting green color as blue.
how can i correct it.
Image of output – https://dl.dropboxusercontent.com/u/12382973/leaf_detection_error.png
The color ranges you should use are dependent on your lighting conditions. I would suggest using the range-detector script to help you narrow down on the proper color thresholding values. You should also read this blog post as well.
thanks. i will try it out.
Hello,
This is a great post and really helped a lot. Is the post on how to learn colors out? Really waiting to see how that would work!
Hey Akilesh — I have not written the tutorial on learning colors. It is still in my idea queue. I’ll be sure to let you know when I write it.
Hi Adrian,
Thansk for great works,
How can i use terminal command ‘$ python detect_color.py –image example_shapes.png’ in a python code. I will use this code in a raspberry pi and my main code will be in pyhton?
Can i arrange upper and lower baundaries for the colors like your Object Track Movement codes.
Thanks…
sincerely…
Hi Onur — I’m not sure what you mean by use the terminal command inside the Python code?
I will use this code as a subroutine in my main python code. How can I call this code in my main python code? For example, in main python code, I want to say like ‘detect_color(example_shapes) . I am beginner in python and raspberry sorry for this.
sincerely…
You would need to define your own function that encapsulates this code. I would highly recommend that you spend a little time brushing up on Python and how to define your own functions before continuing, otherwise you may find yourself running into many errors and unsure how to solve them. Let me know if you need any good resources to learn the Python programming language.
It is a very useful example, but how to get the “color name” of a ROI in the image, I don’t know how to convert the RIO to a “contour” that I can pass to label() ?
Could you help with ?
Hey Julien — can you elaborate more on what you mean by “color name of an ROI”? This blog post demonstrates how to take a region of an image and determine the color name. I’m not sure how this is different from what you want to accomplish?
hello Adrian –
can i get a code for how to detect the different colors of an different objects?
That really depends on your project. What types of objects are you trying to recognize/detect?
my project is to recognize the color of clothes.
Hello Adrian!
First of all, amazing work!
I just started to learn python programming + OpenCV, aiming an Engineering Final project for my university, and your examples and tutorials posted here are helping a lot!
I was wondering where can i download the image you utilized here in this tutorial?
Thanks!
Hey Wilton — use the “Downloads” section of this post to download the source code + example image. Cheers.
Hi, Adrian,
I am using windows 7 and could not figure out a way to install scipy, as it is not supported by any windows system, is there any other way to do so or can you help me install scipy please.
Hi Fiona — I have not used Windows in over 10+ years and do not officially support it here on the PyImageSearch blog. I hope another PyImageSearch reader can help you out, otherwise I highly recommend that you use a Unix-based development environment such as Linux or macOS for computer vision development.
Hey Adrian, thanks for your efforts
I need to define a scale for colors, i.e between (255,0,0) and (255,255,0)
I couldn’t find a way for this “ColorLabeler” to transform it. Also no other post on your blog satisfies it. Can you provide some help?
Can you elaborate on what you mean by a “scale for colors”? Are you trying to define a range of RGB values that will allow you to detect an object? Some more details would be helpful here.
Hello Sir,
when I run the program appears error like this.
from scipy.spatial import distance as dist
ImportError: No module named scipy.spatial
can u help me sir?
You need to install SciPy:
$ pip install scipy
Hi, is that “learning colours” follow up post anywhere near the top of you queue yet ?
Unfortunately no, I’m doing a lot of deep learning tutorials at the moment. I will try to cover this in the future but I’m honestly not sure if/when this will be.
if i have to find yellow and orange color in object how can i do it
You could either (1) look up these colors in the L*a*b* color space or (2) detect the color range via color thresholding.
Hey buddy..thanks a lot ..this really helped me…but i am stucked somewhere
as i have to perform this on various different images with different backgrounds of different color.
So what to be done if the background color is something else instead of black.
for eg : the background is [176 228 239].
Please help.
can you tell me why im getting this error
File “D:\python_progs\fun.py”, line 9, in
resized = imutils.resize(image, width=300)
File “C:\Python27\imutils\convenience.py”, line 69, in resize
(h, w) = image.shape[:2]
AttributeError: ‘NoneType’ object has no attribute ‘shape’
Your image was not correctly read via
cv2.imread
. Double-check the path to your input image. Secondly, be sure to read this blog post on NoneType errors.Hi Adrian,
I have learnt many things from your posts in image processing.
You replied to RAVIVARMAN and jeorge that we can range-detector script to find threshold of a color. But this script gives us lower and upper thresholds. How we use these thresholds to build our own color dictionary while your dictionary only contains one threshold for each color: Red, Green, Blue. Thanks Adrian.
I would suggest finding as tight of a boundary as you can via the range-detector script, take the RGB average between the color ranges, and then convert to L*a*b*.
Thanks Adrian. I just one more quick question. I see the post (https://pyimagesearch.com/2015/09/14/ball-tracking-with-opencv/) you use thresholds in HSV to detect color of the green ball, but in this post you use L*a*b instead. Can you please explain the reason? Thanks Adrian.
I use HSV to define the color range as HSV tends to be a more intuitive color space for humans to understand and define color ranges in. However, L*a*b* is more similar to how humans interpret color while at the same time the Euclidean distance between L*a*b* colors has perceptual meaning.
Hi Adrian,
I downloaded the code and run but found only the names and frames of the shapes. name of color did not write.
Thanks for .the lesson
Hi Cüneyt — can you please double-check that you downloaded the source code to this post? I have another tutorial on simple shape detection that uses the same example images as this one. You may have downloaded the incorrect code.
Hi adrian,
when i’m using “red” : (255,0,0), “green” : (0,255,0) like you’ve done.
sometimes when code run is only detection red color from the video.
and i’m compile the same code for second time and then only detect the green, the red is not.
i want the red and green detect at the same time..
can you help me this adrian?
Thank you
You’ll likely need to tune the color threshold ranges for your specific objects. You might also want to use the HSV or L*a*b* color spaces as well.
thank you adrian,
i’m using hsv range in array mode like you did.
is the mask frame will show mask from red, blue, and green at the same time?
because when i run my code, the frame only show me the red one, not with blue or green.
The mask will show the color threshold for whatever the current tuple (RGB, HSV, or L*a*b*) color range is. In your case, I think you need to continue to tune the values.
I have read the other article on color statistics, but I am still confused. Why can’t I use the mean of the masked region to recreate a shape with the same color. I tried that, but the color is not equal to the masked region (not because of the difference in order of the red green and blue)
You can use the “cv2.mean” function and pass in your mask to compute the RGB average of your input image (and only for that particular masked region). The color would not be “equal” to the masked region since you are by definition computing the mean of the region. A mean summarizes the distribution of those pixels so I’m a bit confused by your question here.
Hi Adrian,
I’m working on a course project to identify and count US coins using HoughCircles. Would the use of L*a*b be appropriate for discerning nickels & dimes versus pennies? The diameter of a dime and penny are so close that slight camera distortion or shading causes an error in the radius measured by HoughCircles. I want to use the color as well to qualify the results. I’m already using camera calibration to reduce those errors.
Thanks for all your great blogs,
Brian
Since nickels/dimes are more silver and pennies are more copper I would use either HSV or L*a*b* and then compute a simple color histogram for each coin.
Why does the calculated mean differ so much from the color in the region?
If I replace:
cv2.drawContours(image, [c], -1, (0, 255, 0), 2)
with
cv2.drawContours(image, [c], -1, mean, 2)
with the calculated mean for each contour, it draws a boundary around the region with a very different color than inside the region
Hey Al, you should see my reply to your first comment. From there I think you should check that you are actually computing the mean for the masked region — my guess is that there is a bug in your code and you are not.
Hi Adrian,
I use the same mask and mean that you define in the other script (colorlabeler.py)
So it’s eroded a bit, but still that wouldn’t explain why it’s so different. I extract this from this script and use it to draw a contour just like you do in green. It’s also not because of the difference in RGB order as I said(tried all six configurations)
Did you visualize the mask after the erosion to ensure it still captures the region you are still interested in? Your function looks correct and I believe the bug is elsewhere in your code. Perhaps your “image” has been resized elsewhere and you are accidentally passing the original into the input image and therefore computing the RGB mask for the incorrect region? Sorry I cannot be of more help here but it’s very likely that your bug is elsewhere in the script. Double-check your preprocessing steps.
Yes, I was using the wrong color space. Thanks for your help
After identifying a contour, is there a way to calculate the “sharpness” of the edge? ie seeing how fast the color changes from the background color to the object color? I have an idea, but I’m wondering if there is an easy way for it and even in my idea I don’t know exactly how to walk perpendicular to a contour in order to do that
Could you clarify “sharpness” in this context? Sharpness could refer to quite a few things in computer vision/image processing. Are you referring to the angle between two edges and how sharp they are? Or how dramatic the intensity change is between the edge?
How dramatic the intensity changes
Take a look at the Gradient magnitude representation of the image — this will give you the change in gradient. Popular methods for computing the gradient include Sobel and Schaar. See this blog post for an example.
Hi Adrain,thank you for the tutorial.
I tried to use your tutorial in my Android project.When I calculated the mean of image and mask, the bug occurs, which said that the mask was empty or the mask’s type ==0. But I checked that the mask wasn’t empty and its type was 16. Do you have any idea what’s wrong?
Hm, I’m not sure what may be causing that error. I haven’t used OpenCV with Android/Java before. You might want to post on the OpenCV GitHub Issues page.
Hi Andrew,
In the above code, you are finding the mean of the pixels in the region of interest. Instead of taking mean, If we replace that with median value(Most occurring pixel value in the region of interest), Will it give better accuracy? I tried it with cv2. But its not available in the package.
That really depends on your application. That is something I would try and see. You can also just extract the ROI directly and then use NumPy’s median function as well.
Hello Sir, How can I detect hologram from national id card.
hi
eroor
ImportError: No module named scipy.spatial
What should I do to fix this?
Thankyou
You need to install the SciPy library:
$ pip install scipy
perfectly working….. its great. i love it
can u suggest me, how can i get the output – name of color in sound format?
i also want to use the camera instead of images
thanks lot its great. i love it
Thanks Vitik, I’m glad you enjoyed the tutorial!
this is not exactly a reply – more a question
I need to get the rgb value ( _,_,_) of the center of each circle. (8 in total)
So far I can detect it, I can draw on it, but I need the coordinates x,y values and even more important the color information of that point
You can access the pixel values like this:
(B, G, R) = image[y, x]
If you need further help with the basics of OpenCV I would suggest you read through Practical Python and OpenCV. That book will teach you the fundamentals.
hey Adrian. Yes, I have the book and as long as I ‘ ll find spare time, I will continue reading it.
My issue now is that right after I applied the cv.HoughCircles command, and I got all the circles, I wrote the data of the center of circles in a text file. While reading the text file, I notice that x and y are ‘opposite’ so to get the same result as on the image. It confuses me – I don’t get what can there be wrong
I was abit disappointed cause I couldn’t get the result I wanted while trying for a couple of hours, but since I changed the
for i in circles[0, :]:
and replaced it with
for (x,y,r) in circles:
as in your example of Detecting Circles in Images using OpenCV and Hough Circles.
Thanks for all the information you offer us
Hey Antonios — I just wanted to followup with you. Were you able to resolve the issue?
But it is not working for the image containing white and gray color.Only the outline of the input image is detected rather than the shapes in the image.
i mean background of white and grey it is only working for black
Threshold the image such that the background becomes black. Your foreground objects must appear as “white” on a “black” background.
It is giving us nice visualization using bar graph, but I need to have it in terms of text that which color it is. I tried to put the value of top dominant color, but it’s giving value in terms of matrix. How can I have in text? I need to add the color name in the database.
Also, how we will eliminate black/white (top dominant color) from this dominant color and save the next color name?
I’m not sure what you mean by “in terms of text”. This tutorial gives you the name of the color that was recognized.