If you haven’t noticed, the term “feature vector” is used quite often in this blog. And while we’ve seen it a lot, I wanted to dedicate an entire post to defining what exactly a feature vector is.
What is an Image Feature Vector?
Image Feature Vector: An abstraction of an image used to characterize and numerically quantify the contents of an image. Normally real, integer, or binary valued. Simply put, a feature vector is a list of numbers used to represent an image.
As you know, the first step of building any image search engine is to define what type of image descriptor you are going to use. Are you trying to characterize the color of an image and extracting color features? The texture? Or the shape of an object in an image?
Once you have selected an image descriptor, you need to apply your image descriptor to an image. This image descriptor handles the logic necessary to quantify an image and represent it as a list of numbers.
The output of your image descriptor is a feature vector: the list of numbers used to characterize your image. Make sense?
Two Questions to Ask Yourself
Here is a general template you can follow when defining your image descriptors and expected output. This template will help ensure you always know what you are describing as well as what the output of your descriptor represents. In order to apply this template, you simply need to ask yourself two questions:
- What image descriptor am I using?
- What is the expected output of my image descriptor?
Let’s make this explanation a little more concrete and go through some examples.
If you’re a frequent reader of this blog, you know that I have an obsession with both Jurassic Park and Lord of the Rings. Let’s introduce my third obsession: Pokemon. Below is our example image that we will use throughout this blog post — a Charizard.
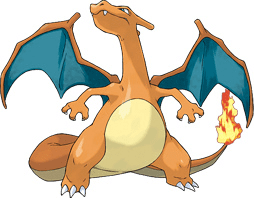
Now, fire up a Python shell and follow along:
>>> import cv2 >>> image = cv2.imread("charizard.png") >>> image.shape (198, 254, 3)
Here we are just importing cv2
, our Python package that interfaces with OpenCV. We then load our Charizard image off of disk and examine the dimensions of the image.
Looking at the dimensions of the image we see that it has a height of 198 pixels, a width of 254 pixels, and 3 channels — one for each of the Red, Green, and Blue channels, respectively.
Raw Pixel Feature Vectors
Arguably, the the most basic color feature vector you can use is the raw pixel intensities themselves. While we don’t normally use this representation in image search engines, it is sometimes used in machine learning and classification contexts, and is worth mentioning.
Let’s ask ourselves the two questions mentioned in the template above:
- What image descriptor am I using? I am using a raw pixel descriptor.
- What is the excepted output of my descriptor? A list of numbers corresponding to the raw RGB pixel intensities of my image.
Since an image is represented as NumPy array, it’s quite simple to compute the raw pixel representation of an image:
>>> raw = image.flatten() >>> raw.shape (150876,) >>> raw array([255, 255, 255, ..., 255, 255, 255], dtype=uint8)
We can now see that our image has been “flattened” via NumPy’s flatten
method. The Red, Green, and Blue components of the image have been flattened into a single list (rather than a multi-dimensional array) to represent the image. Our flattened array has a shape of 150,876 because there exists 198 x 254 = 50,292 pixels in the image with 3 values per pixel, thus 50,292 x 3 = 150,876.
Color Mean
Our previous example wasn’t very interesting.
What if we wanted to quantify the color of our Charizard, without having to use the entire image of raw pixel intensities?
A simple method to quantify the color of an image is to compute the mean of each of the color channels.
Again, let’s fill out our template:
- What image descriptor am I using? A color mean descriptor.
- What is the expected output of my image descriptor? The mean value of each channel of the image.
And now let’s look at the code:
>>> means = cv2.mean(image) >>> means (181.12238527002307, 199.18315040165433, 206.514296508391, 0.0)
We can compute the mean of each of the color channels by using the cv2.mean
method. This method returns a tuple with four values, our color features. The first value is the mean of the blue channel, the second value the mean of the green channel, and the third value is the mean of red channel. Remember, OpenCV stores RGB images as a NumPy array, but in reverse order. We actually read them backwards in BGR order, hence the blue value comes first, then the green, and finally the red.
The fourth value can be ignored and exists only so that OpenCV’s built-in Scalar
class can be used internally. This value can be ignored as such:
>>> means = means[:3] >>> means (181.12238527002307, 199.18315040165433, 206.514296508391)
Now we can see that the output of our image descriptor (the cv2.mean
function) is a feature vector with a list of three numbers: the means of the blue, green, and red channels, respectively.
Color Mean and Standard Deviation
Let’s compute both the mean and standard deviation of each channel as well.
Again, here is our template:
- What image descriptor am I using? A color mean and standard deviation descriptor.
- What is the expected output of my image descriptor? The mean and standard deviation of each channel of the image.
And now the code:
>>> (means, stds) = cv2.meanStdDev(image) >>> means, stds (array([[ 181.12238527], [ 199.1831504 ], [ 206.51429651]]), array([[ 80.67819854], [ 65.41130384], [ 77.77899992]]))
In order to grab both the mean and standard deviation of each channel, we use the cv2.meanStdDev
function, which not surprisingly, returns a tuple — one for the means and one for the standard deviations, respectively. Again, this list of numbers serves as our color features.
Let’s combine the means and standard deviations into a single color feature vector:
>>> import numpy as np >>> stats = np.concatenate([means, stds]).flatten() >>> stats array([ 181.12238527, 199.1831504 , 206.51429651, 80.67819854, 65.41130384, 77.77899992])
Now our feature vector stats
has six entries rather than three. We are now representing the mean of each channel as well as the standard deviation of each channel in the image.
Color Histograms
Going back to the Clever Girl: A Guide to Utilizing Color Histograms for Computer Vision and Image Search Engines and Hobbits and Histograms, we could also use a 3D color histogram to describe our Charizard.
- What image descriptor am I using? A 3D color histogram.
- What is the expected output of my image descriptor? A list of numbers used to characterize the color distribution of the image.
>>> hist = cv2.calcHist([image], [0, 1, 2], None, [8, 8, 8], [0, 256, 0, 256, 0, 256])
Here we have a 3D histogram with 8 bins per channel. Let’s examine the shape of our histogram:
>>> hist.shape (8, 8, 8)
Our histogram has a shape of (8, 8, 8)
. How can we use this as a feature vector if it’s multi-dimensional?
We simply flatten it:
>>> hist = hist.flatten() >>> hist.shape (512,)
By defining our image descriptor as a 3D color histogram we can extract a list of numbers (i.e. our feature vector) to represent the distribution of colors in the image.
Summary
In this blog post we have provided a formal definition for an image feature vector. A feature vector is an abstraction of the image itself and at the most basic level, is simply a list of numbers used to represent the image. We have also reviewed some examples on how to extract color features.
The first step of building any image search engine is to define your image descriptor. Once we have defined our image descriptor we can apply our descriptor to an image. The output of the image descriptor is our feature vector.
We then defined a two step template that you can use when defining your image descriptor. You simply need to ask yourself two questions:
- What image descriptor am I using?
- What is the expected output of my image descriptor?
The first question defines what aspect of the image you are describing, whether it’s color, shape, or texture. And the second question defines what the output of the descriptor is going to be after it has been applied to the image.
Using this template you can ensure you always know what you are describing and how you are describing it.
Finally, we provided three examples of simple image descriptors and feature vectors to make our discussion more concrete.
What's next? We recommend PyImageSearch University.
86 total classes • 115+ hours of on-demand code walkthrough videos • Last updated: October 2024
★★★★★ 4.84 (128 Ratings) • 16,000+ Students Enrolled
I strongly believe that if you had the right teacher you could master computer vision and deep learning.
Do you think learning computer vision and deep learning has to be time-consuming, overwhelming, and complicated? Or has to involve complex mathematics and equations? Or requires a degree in computer science?
That’s not the case.
All you need to master computer vision and deep learning is for someone to explain things to you in simple, intuitive terms. And that’s exactly what I do. My mission is to change education and how complex Artificial Intelligence topics are taught.
If you're serious about learning computer vision, your next stop should be PyImageSearch University, the most comprehensive computer vision, deep learning, and OpenCV course online today. Here you’ll learn how to successfully and confidently apply computer vision to your work, research, and projects. Join me in computer vision mastery.
Inside PyImageSearch University you'll find:
- ✓ 86 courses on essential computer vision, deep learning, and OpenCV topics
- ✓ 86 Certificates of Completion
- ✓ 115+ hours of on-demand video
- ✓ Brand new courses released regularly, ensuring you can keep up with state-of-the-art techniques
- ✓ Pre-configured Jupyter Notebooks in Google Colab
- ✓ Run all code examples in your web browser — works on Windows, macOS, and Linux (no dev environment configuration required!)
- ✓ Access to centralized code repos for all 540+ tutorials on PyImageSearch
- ✓ Easy one-click downloads for code, datasets, pre-trained models, etc.
- ✓ Access on mobile, laptop, desktop, etc.
Join the PyImageSearch Newsletter and Grab My FREE 17-page Resource Guide PDF
Enter your email address below to join the PyImageSearch Newsletter and download my FREE 17-page Resource Guide PDF on Computer Vision, OpenCV, and Deep Learning.
Tomasz Malisiewicz
Hi Adrian,
What you describe (color histogram or global mean RGB) is referred to as an “image descriptor” in my social circles while “feature descriptor” is reserved for a descriptor centered around a local image point. The word “feature” is actually all over the place, but most CV researchers I know think of SIFT as the best example of a “feature descriptor” or just “descriptor” and GIST as the best example of “image descriptor.”
“Feature vector” or just “feature” is loosely anything that comes out of some data processing and will be used as input to a machine learning algorithm. I’m pretty sure the experts (like us) just throw around these words loosely, but a novice might be intimidated by our vocabulary.
In addition to going through your tutorials, people seriously interested in computer vision need to make computer vision friends (or go to graduate school) and regularly talk about these things over coffee.
Keep the tutorials coming!
–Tomasz
Adrian Rosebrock
Hi Tomasz, thanks for commenting. You bring up a really good point. There certainly is a difference in terminology between an “image descriptor”, “descriptor”, and “feature vector”.
I remember back when I was an undergrad taking my first machine learning course. I kept hearing the term “feature vector” and as you suggested, it was a bit intimidating. In all reality, it’s just a list of numbers used to abstract and quantify an object. That was the point I was trying to get across in this post — trying to make a concept that can be complex, boiled down to a simple example.
Perhaps one of my next blog posts should disambiguate between the terms and (hopefully) provide a little more clarity. I can definitely see how all these similar terms can cause some confusion.
Tatsiana Puchyla
Hello!
Can anybody tell me what should I do to create GIST image descriptor on python? Thank you!
Adrian Rosebrock
It’s actually implemented for you in this package.
ngapweitham
I am a bit confusing about the meaning of the terms, following are my understanding
image descriptor == data get from the whole image
feature descriptor == data get from the local point of an image(a small region)
descriptor == feature descriptor
feature vector == a bunch of data which could feed to the machine learning algo
sometimes feature descriptor == feature vector because they could feed to the machine learning algo and extract from the local point of an image
please correct me if I get them wrong
Adrian Rosebrock
Indeed, the terminology can get a bit confusing at times, especially since the terms can be used interchangeably and the only way to figure out which-is-which is via context! However, it looks like you understand it quite well. An image descriptor is applied globally and extracts a single feature vector. Feature descriptors on the other hand describe local, small regions of an image. You’ll get multiple feature vectors from an image with feature descriptors. A feature vector is a list of numbers used to abstractly quantify and represent the image. Feature vectors can be used for machine learning, building an image search engine, etc.
ManuelaP
Hi,
There are something that I don’t understand if the different extracted features are not the same size, like a monodimensional feature and a vector feature, how could I merge this features on a vector to do after a selection feature? Because if the features have not the same size, my method to do the features ranking is not able to know it. Do you understand my question??
Thanks
Adrian Rosebrock
If your feature vectors are not the same dimensionality, then in general, it doesn’t make much sense to compare them. If you perform feature selection, you’ll want to select the same features (i.e., columns) from every feature vector in your dataset.
tota
i apply GLCM texture feature, the output is matrix, is this feature vector?
Adrian Rosebrock
Typically, the GLCM matrix isn’t used directly as a feature vector. You instead compute statistics on this matrix, such as Haralick texture.
The mahotas library has a good implementation of Haralick texture features.
Ankit
If I am taking a gray-scale multiple images and using them to form a feature vector of pixels gray-level values. Value of pixel will range from 0-255. Each pixel will have different value depending on the image. For example, pixel at 0th position will have value 255 in one image, 128 in another, 3 in another, and so on. We will have an intensity distribution for each pixel from multiple images rather than a single value. Then, how can I decide which pixel values to use for feature vectors?
Thank you for your time.
Adrian Rosebrock
Hey Ankit — I’m not sure exactly what you are trying to accomplish. It sounds like you need to construct a look-up table for each pixel value to determine it’s proper value. If you can explain a little bit more about what your end goal is, and why you’re doing this, it would be helpful.
Ankit
Thank you for replying. I have to detect pedestrian in a gray-scale image. For the feature selection part, I’m taking all the grey pixel values in an image as a feature vector. From the training data set for pedestrian and non-pedestrian, I find the intensity distribution for all the pixel in an image. Using this information, I calculate mean vector and co-variance matrix for pedestrian and non-pedestrian class. My end goal is to classify pedestrian using the above information. The part where I’m confused is how can you build a co-variance matrix if each pixel is a intensity distribution rather than a single value? Do you think my approach is right?
Adrian Rosebrock
For pedestrian detection you typically wouldn’t use the grayscale pixels values. It would be better to extract features from the image, normally Histogram of Oriented Gradients and then train a pedestrian detector on these features.
Joe
Hi Adrian,
Very good article, thank you for writing these posts. In a project I am doing right now I try to detect the material of objects. Basically, the program has to detect if the object has a copper coating or is made out of some brass-like material. I am using 3D histograms like mentioned in your tutorial right now, and compare them to histograms of sample images I have saved previously using cv2.compareHist with cv2.HISTCMP_CORREL. Unfortunately, this seems to give quite unreliable results with changing lighting conditions in the image. Is there a better approach I should be using here? I was looking into kNN-Classification and SVMs, but these methods seem a bit complicated for this (I assume) rather simple task.
Adrian Rosebrock
If you’re trying to detect the texture of an object, I think Local Binary Patterns plus an SVM would work well.
Reshma Bhat
Hi,
Very good article! I’m working on classifying normal/hemorrhagic brain trauma from CT. Tried GLCM computation based feature extraction on 8-bit grayscale CT image. For a sample of 10 datasets too, it doesn’t show any much variation to classify. Is the approach fine? or any other method would work well?
Adrian Rosebrock
Hi Reshma — I have not worked with brain trauma CT images before. Perhaps you have some example images of what you’re working with and what you hope to classify?
Reshma Bhat
Hi..I figured it out. I’m able to extract GLCM features and it varies for healthy and abnormal images after certain pre-processing.Now I have four set of features. How to feed this into SVM to classify using OpenCV Python ?? Any snippet would be grateful. Thanks.
Here is the link to CT brain healthy and hemorrhagic data:
http://www.uwmedicine.org/health-library/PublishingImages/CT-Intracerebral-Hemorrhage.jpg
Adrian Rosebrock
I provide an example of training a SVM in this post. For more details, I would suggest taking a look at Practical Python and OpenCV where I include two chapters on image classification. The PyImageSearch Gurus course also includes 30+ lessons on image classification.
Lench
Hey, Adrian, the problem I’m having now is, from one picture, extract the characters I need. Character arrangement is irregular, and there are many other characters, and interference information. I tried to extract LBP and hog features, but there were still some characters missing and extracted to a character that was not what I needed. How can I completely extract the characters I need,
Adrian Rosebrock
Hey Lench — character detection is really dependent on your dataset. I’ve covered a number of tutorials on how to detect characters using morphological operations. I would suggest starting here. Other than that, it’s tough to provide any suggestions without seeing the particular images you’re working with.
Lench
Hey, Adrian, I saw a tutorial that uses morphological operations to detect characters. But my picture background is more complex, and the interference information is more. The spacing of characters is not the same (each picture is the target character), the arrangement is also kind, how do I deal with it.
Adrian Rosebrock
You might need to try more advanced techniques, such as deep learning. When it comes to complex character detection and recognition I’ve seen LSTMs used with a lot of success.
Lench
Thank you very much for your patience.Adrian
Esraa
Hi, first of all thanks alot for your amazing efforts!
I have a question please, I need to calculate the standard deviation for certain pixel location using python.
The matrix is the probability map
Those certain pixel, are the max. 10 probabilities in the probability map
I don’t know where I can start from, little bit confusing
Thanks alot in advance
Adrian Rosebrock
First, you would take the probabilities and indexes of the map. Sort the probabilities and indexes jointly, in descending order, with larger probabilities at the front of the list. Take those indexes, which are your (x, y)-coordinates, and extract the pixel values from the image. And then compute the standard deviation.
Dave
Adrian – any thoughts on how to apply the notion of “image feature vector” to motion imagery? I am most interested in how to best quantify the motion contents of an image (e.g., direction, magnitude, something else?).
Adrian Rosebrock
I would suggest taking a look at the “optical flow” algorithm.
Jon
Hi ! How can I get the skewness and kurtosis of the color feature?
Adrian Rosebrock
Are you referring to color histograms? Take a look at the SciPy library which allows you to compute skewness and kurtosis over a distribution.
Shubhayu
Hey Adrian, your posts above are very helpful. I am a novice at CV. I problem that I need to solve right now is that of, detecting boundaries of unmarked roads, for autonomous driving. Particularly I am trying to detect road boundaries Inverse Perspective frames.
Till now I have analyzed the color (mean and std. deviation using BGR, HSV, LAB, and YCB separately) of a sample region in front of the car. Then traverse left and right(and then move top) of the sample region, to check if the mean values of this new region (area of this is much smaller than the sample region) deviates by the mean values of the sample region by more than 3 time the std. deviation within the sample region; if so I mark the center of this new region with a dot. Of-course while moving top, I move the sample region top as well. However this approach does not work with any of the color channels used (ie. BGR/HSV/LAB/YCB).
Will not work with a combination of these as well, or will it?
Is there some parameter tuning code that I can use to tweak things like the area of the test and sample region or the threshold etc.?
What other features can I use?
I there a way I can do this pixel by pixel, if so please elaborate? This way I can mark every pixel of the Inverse Perspective frame that has similar features compared to that of the sample region.
I will be grateful for you reply.
Adrian Rosebrock
Detecting road boundaries can be a bit of a challenging problem if you are new to computer vision. Your approach here may work in specific images but will likely fail in other situations. Some of the most accurate methods to detecting/segmenting road boundaries is to use deep learning segmentation networks. I’ll be covering such a network here on the PyImageSearch blog in the coming months but that should give you some keywords to search on until then.
Before getting too far into this project I would recommend you study the fundamentals of computer vision, machine learning, and deep learning more. If you’re interested, I would recommend the PyImageSearch Gurus course and Deep Learning for Computer Vision with Python.
Rajan
how the output of LBP can be sent to machine learning algorithm.
Adrian Rosebrock
Follow this tutorial on Local Binary Patterns and you’ll be able to extract LBPs and pass them into a machine learning model.
esha
hello sir
how to get cdf of an image using mean and standard deviation
KK
Hi.. Brilliant tutorial on Computer vision topics. I am currently working on a scene classification algorithm. I have already extracted the GIST features of the images and have the below queries. It would be great help if you could help me understanding this.
1. Which is better ? CNN or GIST descriptor ? Is GIST descriptor outdated compared to CNN ?
2. Is there a way I could visualize the extracted GIST features on image ?
3. Could you please release tutorial / blog on usage of GIST as well ?
Thank you,
KK
Adrian Rosebrock
No one algorithm is rarely “better” than the other. It’s all about bringing the right tool to the job. That said, CNNs do work very well for scene classification but if you don’t have enough data GIST may work as well. Perhaps you could explain your project more?
KK
Hi Adrian Thanks for the response. Is it ok if I send the complete project details via mail to EMAIL REMOVED ?
Adrian Rosebrock
You should use the PyImageSearch contact form.
KK
Thank you I have sent the details.
Liezheel Mynha Alejandro
Hi, this is a great tutorial for beginners. Thanks a lot! I am currently working on a project to classify garlic varieties. I hope you can share some ideas on these.
1. What other color features can I get from the images?
2. Can you recommend resources on the shape and texture-based features?
Adrian Rosebrock
It’s hard to say what features to use without seeing any example images first. Do you have any you could share?
As for a resource to recommend, definitely consider the PyImageSearch Gurus course. I cover color, shape, and texture descriptors (including when to use each/how to combine them) inside the course.
Nayab Mishal
Hi Adrian, I want to develop a machine learning model that can classify between images of T-shirts and dress-shirts. Each training example is a flattened 28×28 pixel gray-scale image. But firstly i need to extract features from these images and generate a feature vector that can be further fed to the model.
Sir, how can i extract features for this problem. The image descriptor is design of shirts.
thanks in advance
Adrian Rosebrock
I would suggest you read this tutorial on the Fashion MNIST dataset.