Table of Contents
- LLM Observability with Self-Hosted Langfuse and vLLM
- Introduction to LLM Observability with Langfuse
- How Langfuse Fits into an LLM Observability Stack
- Langfuse Architecture for LLM Observability
- Why Understanding LLM Observability Architecture Matters
- Setting Up a Self-Hosted Langfuse and vLLM Stack
- Baseline LLM Application (Before Observability)
- Adding LLM Observability with the Langfuse @observe Decorator
- Running and Verifying a Self-Hosted Langfuse Observability Stack
- Summary
LLM Observability with Self-Hosted Langfuse and vLLM
In this lesson, you will finally demystify what Large Language Model (LLM) observability actually is. It is not just logs or print statements. It is a full, end-to-end view of how your AI system behaves in real-world conditions.
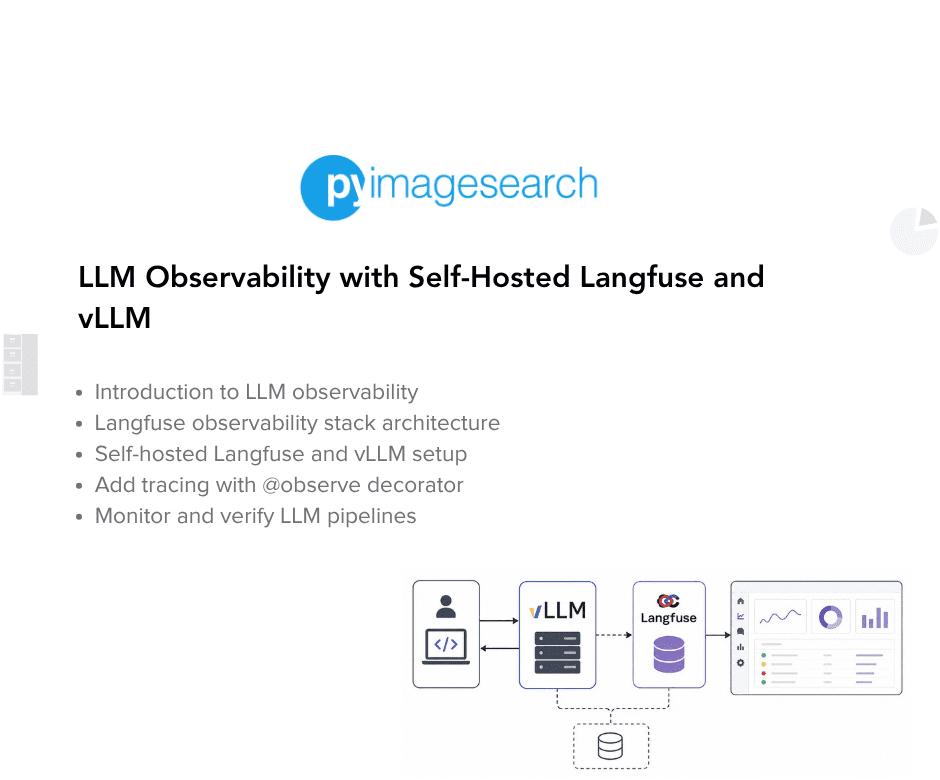
You will learn why modern LLM apps need more than “it works on my machine,” and how traces, token usage, latency, and model interactions become powerful tools for debugging and optimization.
Next, you will roll up your sleeves and self-host Langfuse locally, connect it to a vLLM server, and run your first fully instrumented LLM pipeline from prompt to response.
By the end, you will be exploring live traces in the Langfuse UI, inspecting individual requests, understanding where time is spent, and building a solid foundation for debugging, improving, and scaling every LLM workflow you create.
This lesson is the 1st in a 3-part series on LLM observability with Langfuse:
- LLM Observability with Self-Hosted Langfuse and vLLM (this tutorial)
- Lesson 2
- Lesson 3
To learn how to self-host Langfuse, connect it to vLLM, and build end-to-end LLM observability from the ground up, just keep reading.
Introduction to LLM Observability with Langfuse
Modern LLM applications behave very differently from traditional software. They are probabilistic, non-deterministic, sensitive to prompt phrasing, and often expensive to run. Debugging them requires far more than print statements or simple application logs — you need visibility into how your entire LLM pipeline behaves at runtime.
This section introduces the foundations of LLM observability, explains why classical ML monitoring tools fall short, and sets the stage for building a complete self-hosted Langfuse + vLLM observability stack.
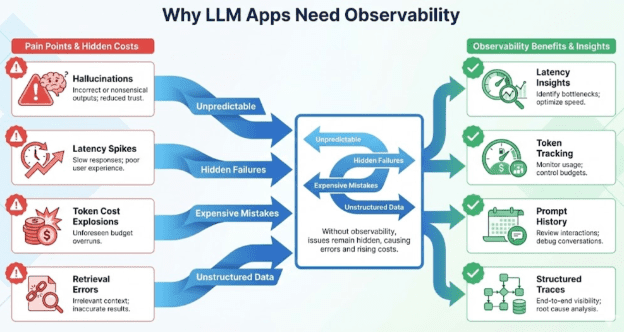
What Problem Does LLM Observability Solve?
LLMs fail in ways ordinary software doesn’t:
- They hallucinate confidently.
- They produce different answers for the same input.
- They slow down under load due to tokenizer/model server issues.
- They cost real money per token.
- They silently degrade when context windows overflow.
- They chain multiple steps, making errors hard to pinpoint.
Without observability, you are essentially debugging blind.
LLM observability gives you visibility into:
- What prompt was sent?
- What did the LLM actually output?
- How long did it take?
- How many tokens did it use?
- Where did a pipeline fail?
- Was this output good or bad?
- What downstream component was impacted?
In short: Observability turns your LLM pipeline from a black box into a glass box.
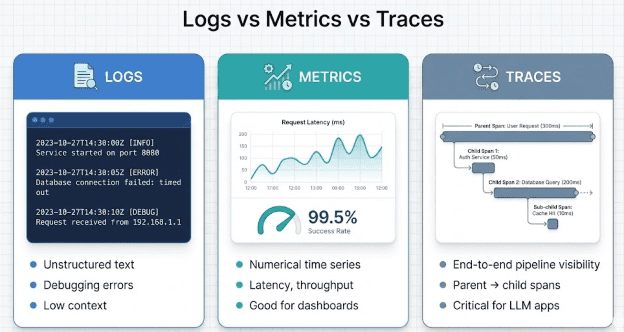
Logs vs Metrics vs Traces (Why Logs Alone Fail)
Modern systems use 3 observability pillars:
Logs
Unstructured text messages. Good for errors; terrible for understanding multi-step LLM pipelines.
Metrics
Numerical time-series (e.g., latency, tokens/sec). Good for dashboards and alerts.
Traces
End-to-end structured records of what happened across a pipeline.
Traces are THE critical component for LLM apps because a single request may produce:
- multiple sub-steps
- multiple model calls
- embeddings
- retrieval calls
- tool invocations
- agent planning
- scoring
- post-processing
Logs tell you what happened. Metrics tell you how often. Traces tell you why.
Why LLM Apps Require Traces, Not Just Logs
LLM-specific debugging demands visibility into things you cannot get from logging alone:
Prompt tracking: See every prompt,systemmessage, andusermessage.- Chain-of-thought structure: (Even if hidden, you can capture high-level execution steps.)
Latency breakdown: Where time is spent: tokenization? forward pass? retrieval?Token usage visibility: Cost control + throughput estimation.- Hallucination hotspots: Which prompts or contexts fail most?
Pipeline correctness: Observations from retrieval → reasoning → generation.
What Is Langfuse? (And Why It Is the Right Tool)
Langfuse is an open-source observability platform designed specifically for LLM apps. It captures:
- Traces
- Spans
- Prompt metadata
- Inputs and outputs
- Token usage
- Latencies
- Scores (quality, correctness, safety)
…and displays them in a clean, production-grade UI.
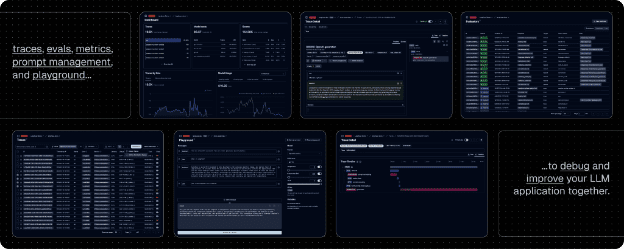
Langfuse PreviewYou can think of it as:
“Prometheus + Grafana + MLflow, but specifically for LLM pipelines.”
Why Not MLflow or Weights & Biases?
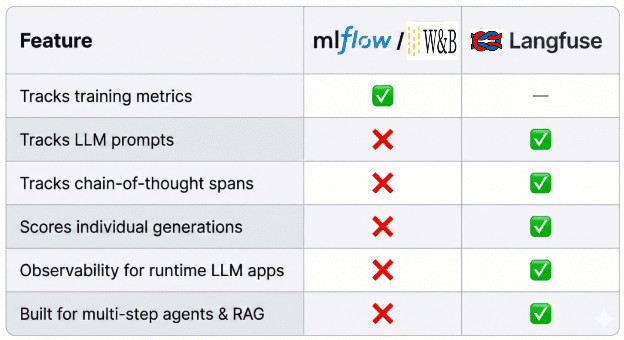
Langfuse provides the most value.How Langfuse Fits into an LLM Observability Stack
Before building anything, consider the mental model:
- Your Python LLM app: Sends prompts and metadata
Langfuse SDK: Records traces locally inside your codevLLM Server(port8000): Handles the actual model inferenceLangfuse Server(port3000): Receives trace data from the SDKLangfuse Worker: Aggregates, transforms, and prepares data for the dashboardPostgreSQLdatabase: Stores all traces, spans, scores, and token countsLangfuse UIdashboard: Displays everything in real time
This flow is the backbone of LLM observability.
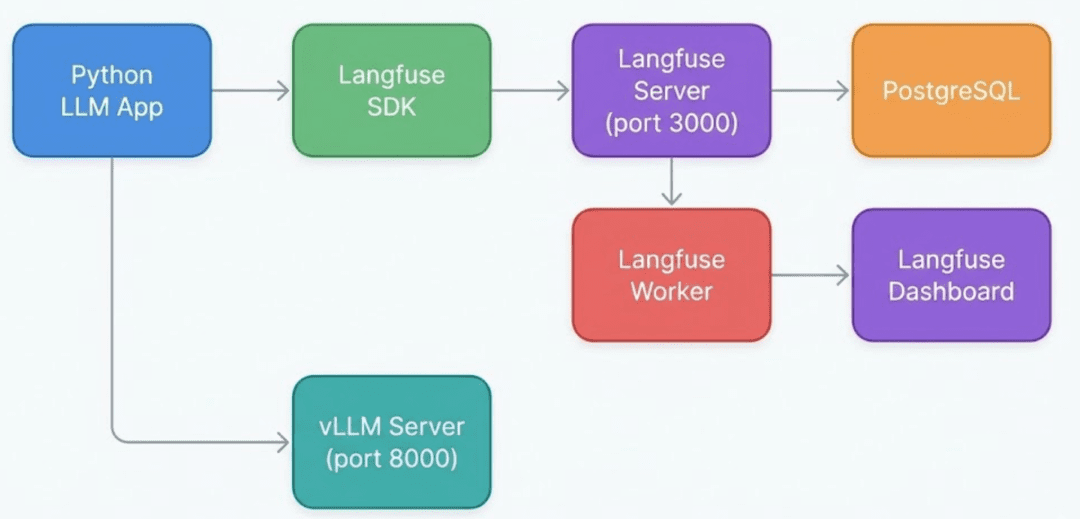
Langfuse SDK logs trace data inside your Python app, the Langfuse Server stores it in PostgreSQL, and the Worker powers the real-time dashboard.Why Self-Hosted Langfuse Instead of Cloud?
When we first integrated Langfuse Cloud during development, we immediately ran into:
- trace delivery delays
- out-of-order spans
- slow UI updates
- unreliable real-time feedback
This is a problem when you are developing an agent or RAG system and need to see:
- the exact prompt
- the exact context
- the exact output
- the exact cost
- immediately after running your script.
So we switched to:
Self-Hosted Langfuse + Local vLLM
Benefits:
- Real-time, near-instant traces
- Fully local development
- No Internet dependency
- Faster iteration loops
- Full control of database and dashboard
- Ideal for agent debugging and RAG evaluation
📌 OPTIONAL CALLOUT
One short bullet note: We still show the Cloud API flow briefly, but everything you build in this module uses the self-hosted setup for real-time performance.
What You Will Build in This Lesson
By the end of Lesson 1, you will have a complete local observability foundation:
Infrastructure
- Self-hosted
Langfuse Server Langfuse Worker(required for dashboards)PostgreSQLdatabasevLLMmodel server (OpenAI-compatible API)
Tracing Skills
- How to instrument an LLM call
- How to build hierarchical traces (pipeline → model call)
- How to log prompts, outputs, latencies, and token usage
- How to visualize traces instantly in the
LangfuseUser Interface (UI)
What You Will Actually Run
- Decorator-based tracing (
tracing_decorator.py) - Baseline app with no tracing (
basic_llm_app.py) vLLM-connected LLM client (llm_utils.py)- Config loaders (
config.py)
vLLM handles inference, the Langfuse Software Development Kit (SDK) records traces, and the Langfuse Server + Langfuse Worker + PostgreSQL power the observability dashboard.Langfuse Architecture for LLM Observability
Before we start installing anything, let us zoom out and understand the architecture of the observability stack you are about to build. Langfuse is not just a dashboard. It is a coordinated system of services that receives traces, stores them, aggregates them, and displays them in real time. Your LLM app, Langfuse, vLLM, and PostgreSQL all work together to form a complete observability pipeline.
Think of this section as building your mental model. Once you understand these flows, all the Docker configuration, YAML files, keys, and scripts will make perfect sense.
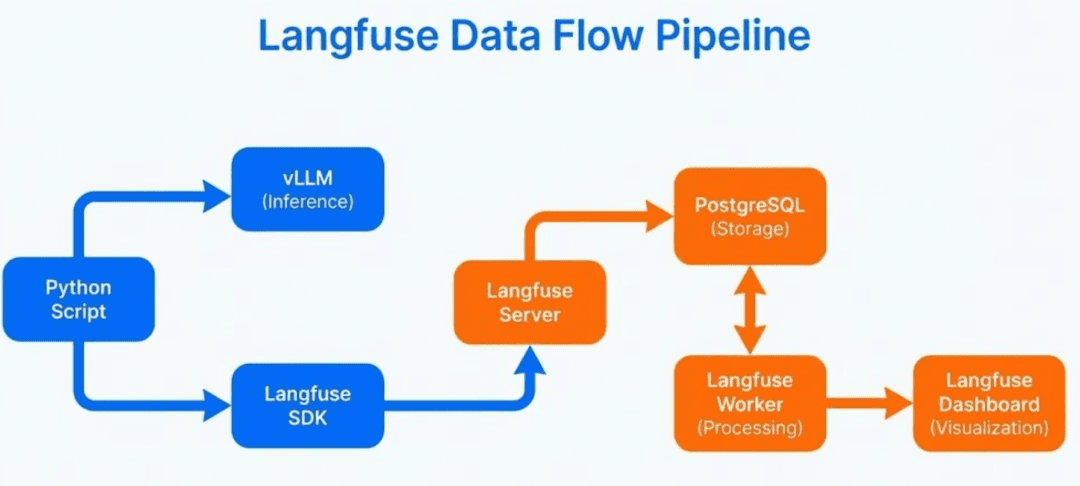
The High-Level Architecture
At the core, your pipeline is simple:
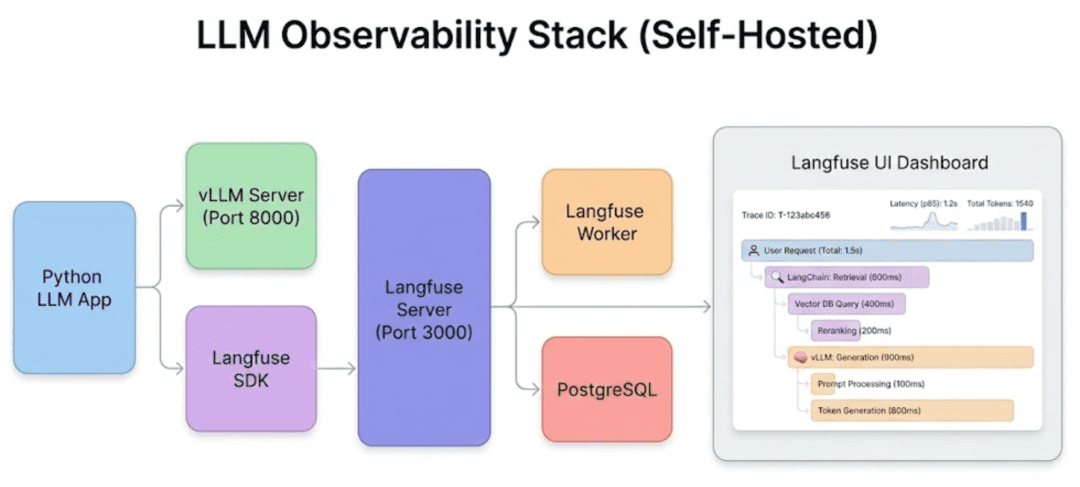
- Your Python LLM app: executes inference and logs traces
LangfusePython SDK: captures all observability datavLLM Server: handles the actual LLM generationLangfuse Server: receives trace, span, and token dataPostgreSQL: stores all traces, metadata, and scoresLangfuse Worker: aggregates data for dashboardsLangfuse UI: visualizes everything instantly
This architecture ensures that every LLM call becomes a structured trace that you can drill into, including latencies, inputs, outputs, steps, errors, and token details.
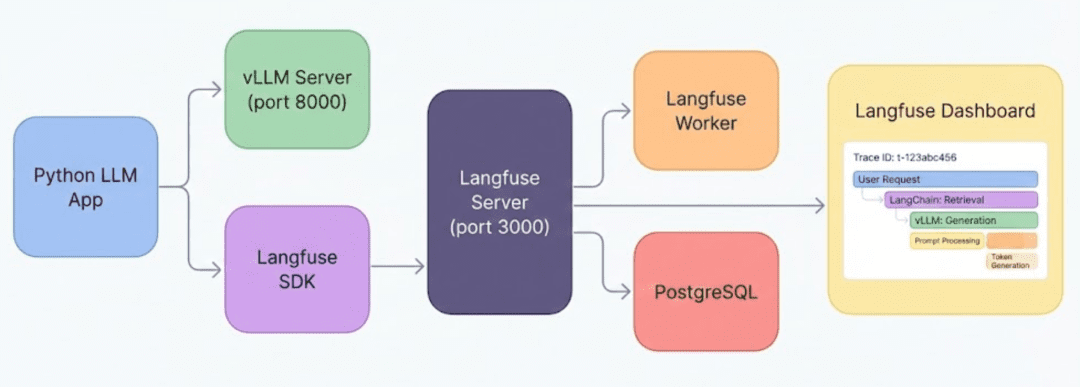
vLLM for inference and the Langfuse SDK for tracing. The Langfuse Server stores data in PostgreSQL, the Langfuse Worker processes it, and the UI displays it.How a Single LLM Request Turns Into a Trace
Every time your code calls client.chat.completions.create(...), Langfuse performs 3 major steps behind the scenes:
- Observe the call: capture input, parameters, metadata.
- Record the output: LLM response, tokens, shapes, errors.
- Create and update a trace hierarchy: pipeline spans, child spans, nested steps.
For example:
llm_pipeline (trace)
    ├── retrieve_context (span)
    ├── rerank_candidates (span)
    └── generate_answer (span)
Even in Lesson 1 (where we only use decorators), you will already produce parent → child traces automatically.
Without this structure, debugging multi-step LLM pipelines becomes guesswork.
Langfuse SDK → Langfuse Server → stored in PostgreSQL → visualized in real time.The Four Core Components You Will Deploy
You will deploy 4 services using Docker Compose:
1. vLLM Server (Port 8000)
Your local LLM inference engine.
It exposes an OpenAI-compatible Application Programming Interface (API) endpoint:
http://localhost:8000/v1
Your Python scripts send prompts here.
2. Langfuse Server (Port 3000)
The brains of the observability system.
It receives traces from the Python SDK, stores them, and exposes the dashboard.
3. Langfuse Worker
Most tutorials miss this, but you cannot get dashboards without the Langfuse Worker.
It processes:
- aggregations
- analytics
- score updates
- background tasks
Without the Langfuse Worker:
you will see traces, but your dashboard will be empty.
4. PostgreSQL (Port 5433 → 5432)
Stores everything:
- traces
- spans
- metadata
- scores
- projects
- settings
It provides the persistence layer that the Langfuse Server depends on.
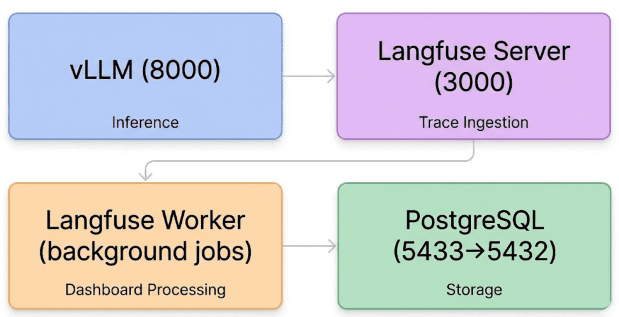
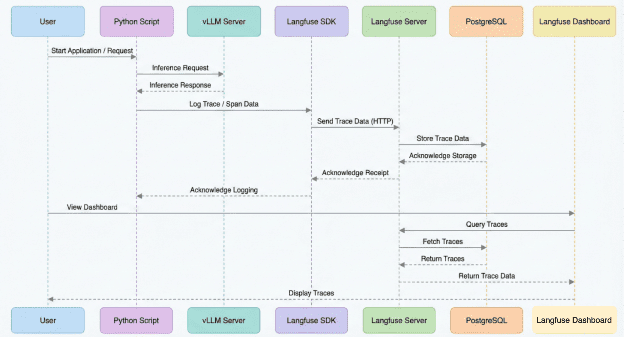
Langfuse stack includes vLLM for inference, Langfuse Server for ingestion, Langfuse Worker for dashboards, and PostgreSQL for storage.How These Components Communicate (Data Flow)
Let us make the full pipeline explicit:
- Your script sends an inference request to
vLLM. - The
Langfuse SDKin your script sends trace info toLangfuse Server. Langfuse Serverwrites raw trace data intoPostgreSQL.Langfuse Workerprocesses raw data to generate:- analytics
- histograms
- span trees
- scores
- The
Langfuse Web UIreads processed data and displays:- full trace trees
- input/output pairs
- token usage
- latency heatmaps
- error stacks
This is the “observability heartbeat” that runs for every request.
Langfuse dashboard.Why Understanding LLM Observability Architecture Matters
Before diving into code, it is important to visualize this system because:
- It prevents confusion when running
Dockerfor the first time. - You will instantly understand errors like “Worker not running” or “Database unavailable”.
- You will know exactly where to look when traces do not appear.
- You will develop intuition about how requests become saved spans.
Once this architectural layer clicks, every file in docker-compose.yml, every script in src/, and every dashboard panel will feel obvious.
Would you like immediate access to 3,457 images curated and labeled with hand gestures to train, explore, and experiment with … for free? Head over to Roboflow and get a free account to grab these hand gesture images.
Setting Up a Self-Hosted Langfuse and vLLM Stack
Before we can trace a single LLM call, we need to set up a clean project skeleton and a fully functioning self-hosted observability stack. In this section, you will configure the environment, install dependencies, review the project layout, understand each configuration file, and bring up the Langfuse + vLLM infrastructure using Docker Compose.
Everything that comes later (tracing, scoring, evaluation, debugging) depends on getting this foundation right.
Project Structure Overview
Here is the complete repository structure we will use throughout this lesson:
├── configs
│   └── config.yaml
├── docker-compose.yml
├── README.md
├── requirements.txt
└── src
    ├── basic_llm_app.py
    ├── config.py
    ├── evaluation_metrics.py
    ├── health_check.py
    ├── llm_utils.py
    ├── run_all_examples.py
    ├── tracing_decorator.py
    └── tracing_manual.py
At a high level:
configs/: stores global configuration used by every example.src/: contains the LLM application scripts, utilities, and tracing examples.docker-compose.yml: defines the entireLangfuse+vLLMinfrastructure.requirements.txt: defines Python dependencies..env.example: defines required environment variables.
We will walk through each piece, focusing not on the logic inside every file, but on how the system is designed and how everything connects.
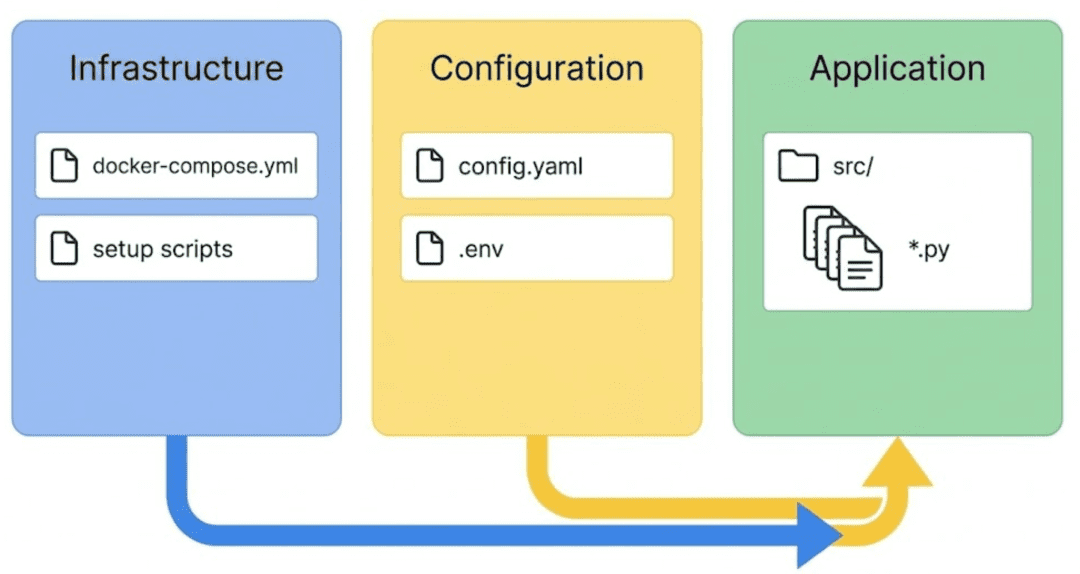
Langfuse observability reusable across different LLM workflows.Installing Dependencies
Install the required Python packages:
pip install -r requirements.txt
The key dependencies in this project are intentionally minimal. We use the following packages:
langfuse>=2.0.0: provides the observability SDK and the@observedecoratoropenai>=1.0.0: is required becausevLLMexposes anOpenAI-compatible API endpointpython-dotenv: loads.envenvironment variablespyyaml: reads configuration values fromconfig.yamlhttpxandrequests: handle health checks and HTTP communicationnumpy: supports scoring and numeric utilities
Together, these packages form the lightweight foundation for our self-hosted observability stack.
Configuring Environment Variables
Copy .env.example into .env:
cp .env.example .env
Then update the following values after starting Langfuse:
LANGFUSE_PUBLIC_KEY="pk-lf-xxxx"
LANGFUSE_SECRET_KEY="sk-lf-xxxx"
LANGFUSE_HOST=http://localhost:3000

OPENAI_BASE_URL=http://localhost:8000/v1
OPENAI_API_KEY=dummy
A few key points:
Langfusekeys come from your local dashboard once you create a project.vLLMdoes not require authentication, but theOpenAIclient still requires an API key value, so"dummy"works.- If you use
Hugging Facemodels that are not cached, you may need a token.
This .env file becomes the backbone for all examples.
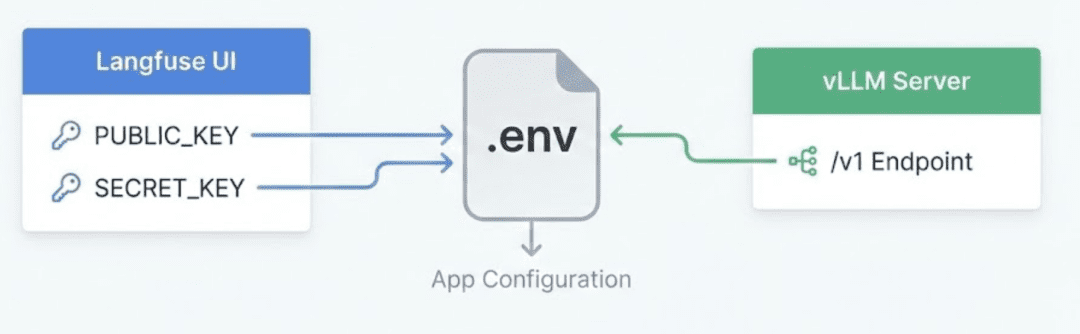
Langfuse keys come from the local dashboard, while vLLM uses an OpenAI-compatible endpoint, with everything funneling into the .env file read by your Python scripts.Centralized Configuration (configs/config.yaml)
Instead of scattering options across scripts, everything is configured through one YAML file:
llm:
  base_url: "http://localhost:8000/v1"
  model: "meta-llama/Llama-2-7b-chat-hf"
  temperature: 0.7
  max_tokens: 300

langfuse:
  host: "http://localhost:3000"
  project_name: "llm-observability-selfhosted"

evaluation:
  enable_scoring: true
  max_latency_ms: 5000
  min_length: 20
  good_length_threshold: 100
This allows you to:
- Switch models without changing code
- Tune evaluation logic centrally
- Redirect LLM traffic to remote endpoints if needed
- Adjust
Langfuse Serverlocation
Every script loads from this file automatically.
Utility Modules (src/config.py and src/llm_utils.py)
These 2 utilities prevent duplication across all examples.
config.py: Central Configuration Loader
This module provides:
load_config(): returns parsedYAMLconfigget_llm_config(): returnsmodel,temp,max_tokensget_langfuse_config(): returnshost,project_nameget_evaluation_config(): returns scoringthresholds
This keeps every script flexible and model-agnostic.
llm_utils.py: Consistent vLLM Client Factory
vLLM supports the OpenAI Python client natively:
client = OpenAI(base_url="http://localhost:8000/v1", api_key="dummy")
This module wraps it into a reusable function:
- Validates environment variables
- Loads model name from
config.yaml - Handles default
base_url - Sets request timeouts
- Returns the
(client, model)tuple when requested
Every tracing example uses this function.
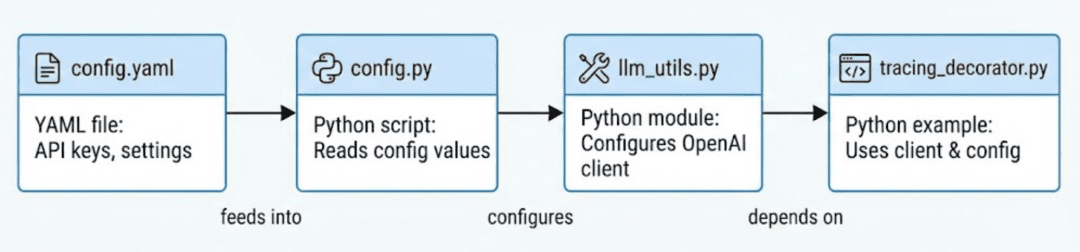
config.py reads YAML → llm_utils.py builds a vLLM client → example scripts use both modules for consistent behavior.The Self-Hosted Stack (docker-compose.yml)
This is the heart of the system.
docker-compose.yml defines:
Langfuse Server
- Runs the frontend + API
- Exposes port
3000 - Performs authentication, API key creation, and trace storage
Langfuse Worker
- Mandatory for dashboards
- Processes traces
- Updates analytics, charts, latency heatmaps
PostgreSQL
- Persistence layer for traces, spans, scores
- Exposed on port
5433(to avoid conflicts)
vLLM Model Server (GPU or CPU)
- Exposes
OpenAI-compatible API athttp://localhost:8000/v1 - Runs
Llama 2by default - Enables fast, local inference for testing
You can start everything with:
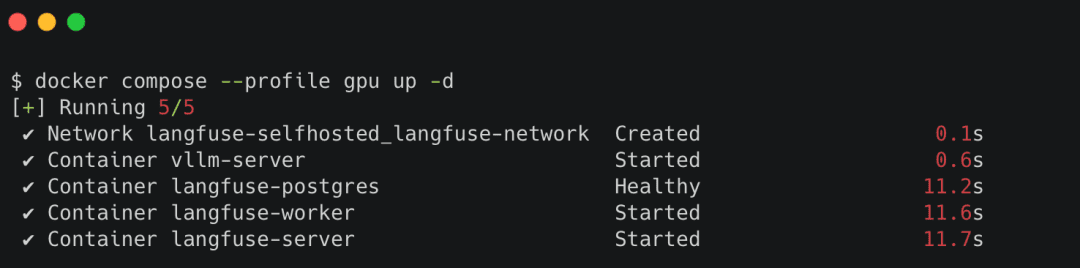
docker-compose --profile gpu up -d
Or if you don’t have a GPU:
docker-compose --profile cpu up -d
Verify services:
docker-compose ps
Visit the Langfuse dashboard: http://localhost:3000
Note: If you are running the server on a remote machine, do not forget to use SSH port forwarding. Otherwise, you will not be able to access the Langfuse UI dashboard from your local machine.
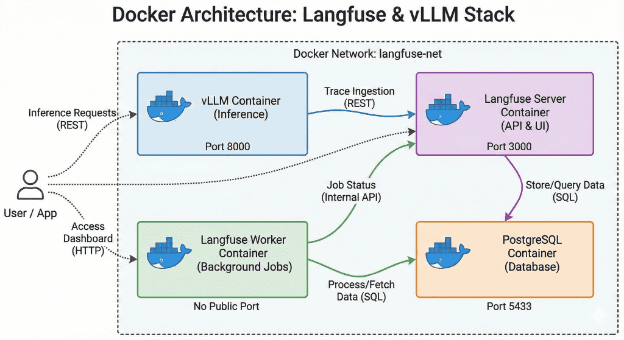
docker-compose setup includes Langfuse Server, Langfuse Worker, PostgreSQL, and vLLM, with each container handling a distinct responsibility within the observability stack.Bringing Up the Entire Observability Stack
Once configuration is in place:
docker-compose --profile gpu up -d
Then:
- Go to
http://localhost:3000 - Create a project
- Copy your public and secret keys
- Paste them into
.env - Restart your Python script
You now have:
- A live model server (
vLLM) - A local observability platform (
Langfuse) - A database storing every trace
- Real-time dashboards
- A clean Python project ready for tracing
The foundation is complete. Next, we will write and trace our first LLM call.
Need Help Configuring Your Development Environment?
All that said, are you:
- Short on time?
- Learning on your employer’s administratively locked system?
- Wanting to skip the hassle of fighting with the command line, package managers, and virtual environments?
- Ready to run the code immediately on your Windows, macOS, or Linux system?
Then join PyImageSearch University today!
Gain access to Jupyter Notebooks for this tutorial and other PyImageSearch guides pre-configured to run on Google Colab’s ecosystem right in your web browser! No installation required.
And best of all, these Jupyter Notebooks will run on Windows, macOS, and Linux!
Baseline LLM Application (Before Observability)
Before we wire in Langfuse, we need a clean baseline: a tiny LLM app that talks to vLLM, prints an answer, and knows nothing about traces, latency, or tokens.
This section walks through src/basic_llm_app.py end-to-end so we have a clear “before” picture of life without observability.
The Full Baseline Script
Here is the full file we will dissect:
"""
Basic LLM Application (No Tracing Baseline)

Simple pipeline using local vLLM server.
This version has NO tracing - compare with tracing_decorator.py
"""

from llm_utils import get_llm_client
from config import get_llm_config

# Initialize vLLM client with model from config
client, model = get_llm_client(load_model_from_config=True)
The docstring sets the tone very clearly:
this is a “no tracing” baseline that we will later compare against a traced version.
We import:
get_llm_client: a reusable helper that knows how to connect tovLLMusingOPENAI_BASE_URLandOPENAI_API_KEY.get_llm_config: a small wrapper aroundconfig.yamlso we don’t hardcode model parameters in the code.
client, model = get_llm_client(load_model_from_config=True) gives us:
- an
OpenAI-compatible client already pointed athttp://localhost:8000/v1 - the model name loaded from
configs/config.yaml.
At this point, the app can already talk to vLLM, but we still have zero observability.
Generating an Answer (With No Tracing at All)
def generate_answer(question: str) -> str:
    """Generate answer using vLLM - NO tracing."""
    # Load config
    llm_config = get_llm_config()
    temperature = llm_config.get("temperature", 0.7)
    max_tokens = llm_config.get("max_tokens", 300)

    try:
        response = client.chat.completions.create(
            model=model,
            messages=[
                {"role": "system", "content": "You are a helpful assistant."},
                {"role": "user", "content": question}
            ],
            temperature=temperature,
            max_tokens=max_tokens
        )
        return response.choices[0].message.content
    except Exception as e:
        print(f"Error: {e}")
        print("Tip: Make sure vLLM is running (docker-compose up -d)")
        raise
Loading config per call
Inside generate_answer, we first pull generation settings from YAML:
llm_config = get_llm_config()loads thellm: section fromconfigs/config.yaml.temperatureandmax_tokensare read with sensible defaults (0.7and300) in case the config is missing keys.
This keeps your generation parameters config-driven, not hardcoded, which is great for experiments, but still does not give you any tracing.
Making the chat completion request
The try block does a standard OpenAI-style chat completion call:
model=modeluses thevLLM-hosted Llama model from your config.messages=[...]constructs a simple conversation with:- a
systemmessage:"You are a helpful assistant." - a
usermessage: the question string passed into the function.
- a
temperatureandmax_tokenscontrol creativity and output length.
vLLM behaves like the OpenAI API here, so response.choices[0].message.content gives us the generated answer, which is then returned.
Error handling (still without observability)
If anything goes wrong (vLLM not running, bad network, misconfiguration), the except block:
- Prints the raw error message.
- Prints a helpful hint:
Make sure vLLM is running (docker-compose up -d). - Re-raises the exception so the script fails loudly.
This is basic error handling, but notice what is still missing:
- No trace of which prompt failed.
- No structured record of latency or context.
- No way to inspect this error later in a dashboard.
Even errors are invisible beyond your terminal scrollback.
Running the “Invisible” Pipeline
def run_simple_pipeline(question: str):
    """Simple pipeline without tracing - baseline example."""
    print(f"\n{'='*50}")
    print(f"Question: {question}")
    print(f"{'='*50}\n")

    print("Generating answer (no tracing)...")
    answer = generate_answer(question)

    print(f"✅ Answer:\n{answer}\n")
    print(f"{'='*50}\n")
run_simple_pipeline is deliberately small and linear:
- It prints a visual separator and echoes the question.
- It calls
generate_answer(question), the black-box LLM call. - It prints the answer and another separator.
This gives you a nice terminal UX, but again, it is only surface-level:
- You see the question and final answer.
- You do not see any internal steps.
- You do not know how long it took.
- You do not know how many tokens it used or how much it cost.
- You cannot compare this run with previous ones.
For anything beyond a toy demo, this is not enough.
The __main__ Block
if __name__ == "__main__":
    question = "What is machine learning?"
    run_simple_pipeline(question)
The entry point is intentionally as minimal as possible:
- It defines a simple default question:
"What is machine learning?" - It calls
run_simple_pipeline(question)
This makes basic_llm_app.py runnable as a one-shot script:
python src/basic_llm_app.py
It is perfect for quick manual testing and serves as a control group when we later add Langfuse tracing and see how much more we can observe.
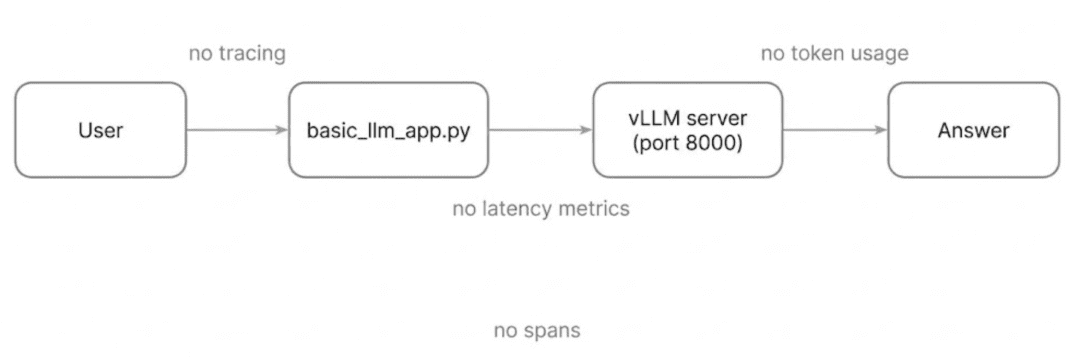
vLLM pipeline returns answers but offers zero insight into prompts, latency, token usage, or internal steps.Why This Baseline Is Not Enough
With this script, your entire view of the system is:
- one printed question
- one printed answer
- and maybe an error line if something crashes
You cannot answer:
- “Why was this slow?”
- “What exact prompt + params did we send?”
- “How many tokens did we consume?”
- “Where did the pipeline fail?”
- “Why is today’s behavior different from yesterday’s?”
For serious LLM work involving RAG systems, agents, evaluation runs, and A/B testing, this is debugging in the dark.
That is exactly what Langfuse is going to fix.
Adding LLM Observability with the Langfuse @observe Decorator
At this point, you have seen how an uninstrumented LLM pipeline behaves: it works, but it hides everything that matters. Now it is time to unlock real observability using the Langfuse @observe decorator, the cleanest and most powerful way to add tracing in Langfuse 2.x.
In this section, we will transform the baseline pipeline into a fully observable workflow, capturing:
- prompts
- outputs
- latency
- token usage
- metadata
- hierarchy of steps (pipeline → model call)
- trace IDs you can click and inspect instantly in
Langfuse
This is where everything finally becomes visible.
Imports, Initialization, and Configuration Logging
import os
from langfuse.decorators import observe, langfuse_context
from llm_utils import get_llm_client
from config import get_llm_config
We import:
observe→ adds tracing automaticallylangfuse_context→ lets us update spans programmatically- our reusable LLM client and config loaders
Before anything happens, the script prints the Langfuse configuration:
print("\n" + "="*70)
print("🔧 LANGFUSE CONFIGURATION")
print("="*70)
print(f"📍 LANGFUSE_HOST: {os.getenv('LANGFUSE_HOST', 'NOT SET')}")
print(f"🔑 LANGFUSE_PUBLIC_KEY: {os.getenv('LANGFUSE_PUBLIC_KEY', 'NOT SET')[:20]}...")
print(f"🔐 LANGFUSE_SECRET_KEY: {os.getenv('LANGFUSE_SECRET_KEY', 'NOT SET')[:20]}...")
print("="*70 + "\n")
This is extremely practical.
It confirms:
Langfusehost- truncated keys
- environment setup correctness
If anything is misconfigured, this block saves you debugging time before you even send a single request.
Finally, we initialize the LLM client:
client, model = get_llm_client(load_model_from_config=True)
The model name and base URL automatically load from the YAML config.
Tracing a Single LLM Call with @observe
Here is the traced model-call function:
@observe(name="generate_answer")
def generate_answer(question: str) -> str:
This single decorator:
- creates a new observation
- wraps the function execution
- automatically timestamps execution
- links child spans to parent spans
Step 1: Recording Inputs
Inside the function, the first thing we do is explicitly log the input:
langfuse_context.update_current_observation(
    input={"question": question, "model": model}
)
This ensures Langfuse displays:
- full question
- selected model
temperatureandmax_tokens(we will update outputs later)
Step 2: Tracking Latency Manually
Although Langfuse timestamps spans automatically, we want explicit latency measurement:
import time
start_time = time.time()
Then we perform the vLLM call:
response = client.chat.completions.create(
    model=model,
    messages=[
        {"role": "system", "content": "You are a helpful assistant."},
        {"role": "user", "content": question}
    ],
    temperature=temperature,
    max_tokens=max_tokens
)
Step 3: Computing Latency + Extracting Answer
latency_ms = (time.time() - start_time) * 1000
answer = response.choices[0].message.content
Adding Outputs, Token Usage, and Metadata
This is the heart of observability:
langfuse_context.update_current_observation(
    output={"answer": answer},
    usage={
        "input": response.usage.prompt_tokens,
        "output": response.usage.completion_tokens,
        "total": response.usage.total_tokens
    },
    metadata={"latency_ms": round(latency_ms, 2)}
)
With a single update call, you give Langfuse:
Outputs
- final LLM response
Usage
- prompt tokens
- completion tokens
- total tokens
Essential for:
- cost analysis
- throughput understanding
- debugging prompt inflation
Metadata
latency_ms(explicit + human-readable)
This is exactly what the baseline pipeline could not show.
Print statements reinforce visibility:
print(f"📊 Latency: {latency_ms:.2f}ms")
print(f"📊 Tokens: {response.usage.prompt_tokens} → {response.usage.completion_tokens} (total: {response.usage.total_tokens})")
Building Nested Traces with run_pipeline()
The pipeline function also uses @observe:
@observe(name="llm_pipeline")
def run_pipeline(question: str):
This creates a parent span.
Any traced function called inside run_pipeline() automatically becomes a child span.
Updating the Trace Metadata
langfuse_context.update_current_trace(
    name="decorator_pipeline",
    metadata={"method": "decorator"}
)
This changes the trace title in the Langfuse UI and adds custom metadata so you always know which instrumentation method you used.
Calling the Nested Span
answer = generate_answer(question)
This produces:
llm_pipeline (parent)
└── generate_answer (child)
The tree structure appears instantly in Langfuse.
Linking Back to the UI
trace_id = langfuse_context.get_current_trace_id()
print(f"🔍 View trace: {langfuse_host}/trace/{trace_id}")
This clickable URL directly opens the exact trace and is extremely useful while iterating locally.
Flushing Traces Before Exit
Short-lived scripts often exit before Langfuse sends data.
This line ensures nothing is lost:
langfuse_context.flush()
print("✅ Traces sent!\n")
Without flushing, traces may appear incomplete or missing entirely.
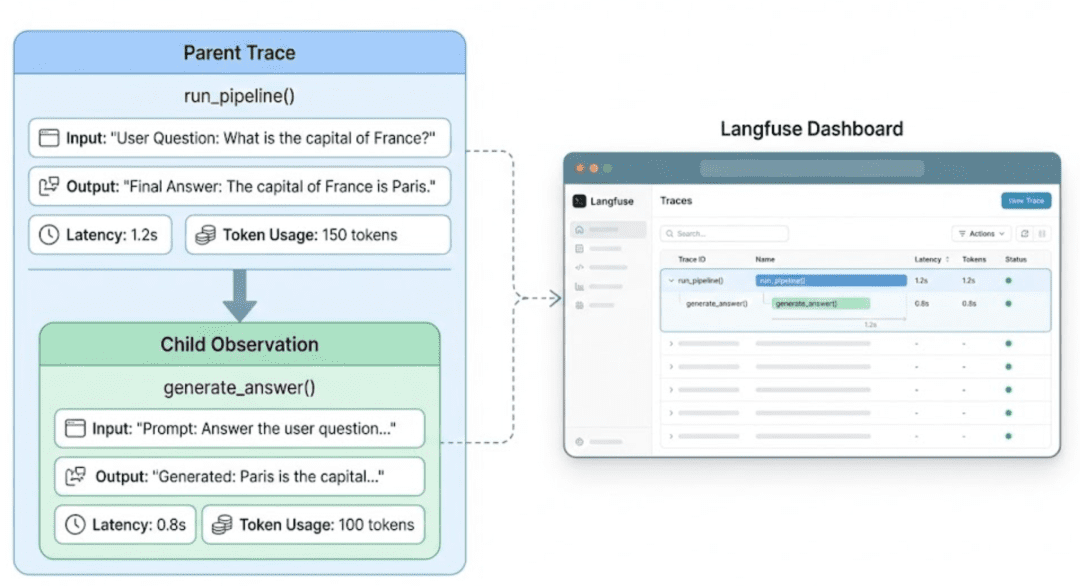
@observe decorator automatically builds a hierarchical trace. The pipeline becomes the parent span, and the model call becomes a child span with full visibility into latency, tokens, and outputs.Why the Decorator Approach Is the Best Default
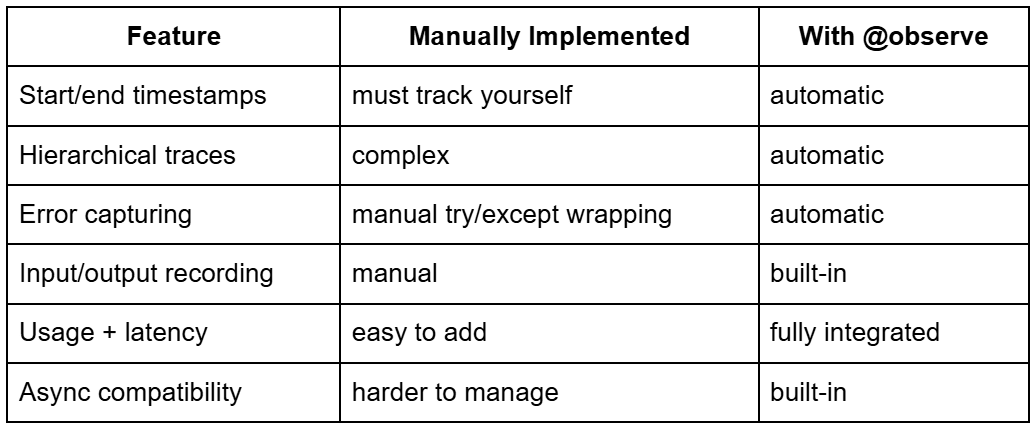
Langfuse’s @observe decorator for automatic observability and trace management in LLM pipelines.This is why nearly every modern Langfuse tutorial and production workflow recommends decorators as the first instrumentation layer.
What You Just Built
Your LLM pipeline now has:
- Clickable traces
- Per-step metadata
- Latency and token breakdown
- Nested trace hierarchy
- Real-time
Langfuse UIupdates - Automatic error propagation
This completes the transformation from:
a blind LLM script → a fully observable workflow.
Running and Verifying a Self-Hosted Langfuse Observability Stack
By now, we have all the moving parts ready:
- the
Langfuse Server+Langfuse Worker+PostgreSQL - the
vLLMmodel server - our traced LLM pipeline using the
@observedecorator
In this section, we will bring everything online, verify the system health, and run the traced pipeline end-to-end. By the end, you will see your first real traces appear instantly inside the Langfuse dashboard.
Start the Self-Hosted Stack
All core services, including Langfuse Server, Langfuse Worker, PostgreSQL, and vLLM, run through your project’s docker-compose.yml.
To start everything with GPU acceleration:
docker compose --profile gpu up -d
Or, if you don’t have a GPU:
docker compose --profile cpu up -d
This launches:
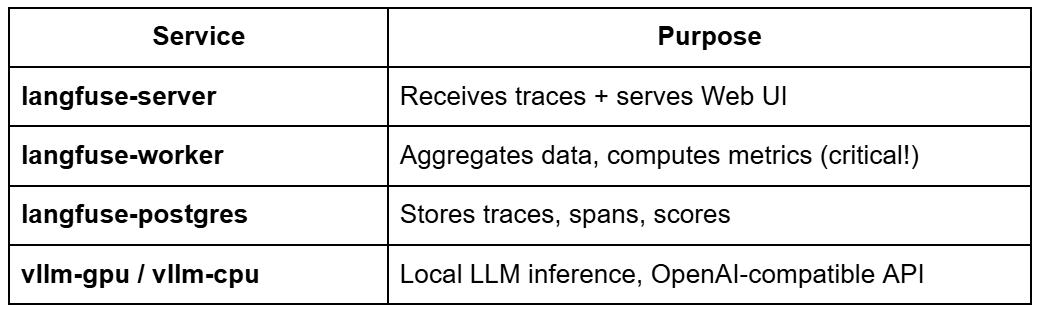
Langfuse deployment services and their roles in trace collection, metric computation, storage, and local LLM inference.You can check everything is healthy using:
docker compose ps
Expected output (sample):
NAME                 STATUS              PORTS
langfuse-server      healthy             0.0.0.0:3000->3000/tcp
langfuse-worker      running
langfuse-postgres    healthy             0.0.0.0:5433->5432/tcp
vllm-server          healthy             host:8000->8000/tcp
Tip:
If langfuse-worker is not running, your dashboard will be empty.
If vllm-server is not healthy, your LLM calls will fail.
Docker Compose.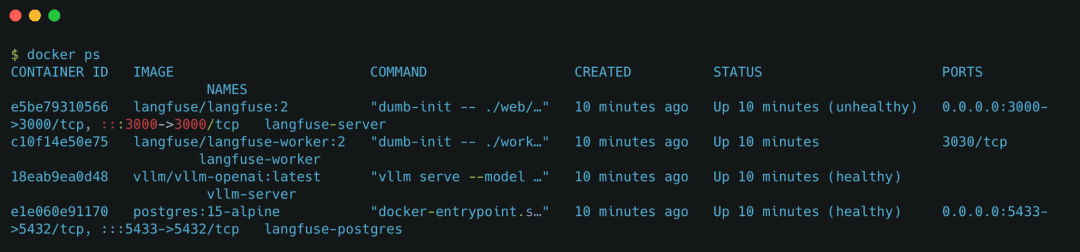
Docker containers running the local Langfuse observability stack, including the Langfuse Server, Langfuse Worker, PostgreSQL database, and vLLM inference service.Verify Each Component Individually
Langfuse Server (UI)
Open:
http://localhost:3000
You should see:
- The
Langfuselogin screen - The dashboard panel
- Empty traces (for now)
vLLM Health
Visit:
http://localhost:8000/health
Expected JSON:
{"status": "ok"}
If this endpoint fails, no LLM calls will work.
PostgreSQL Health (optional)
Inside Docker:
docker compose logs langfuse-postgres
Look for:
database system is ready to accept connections
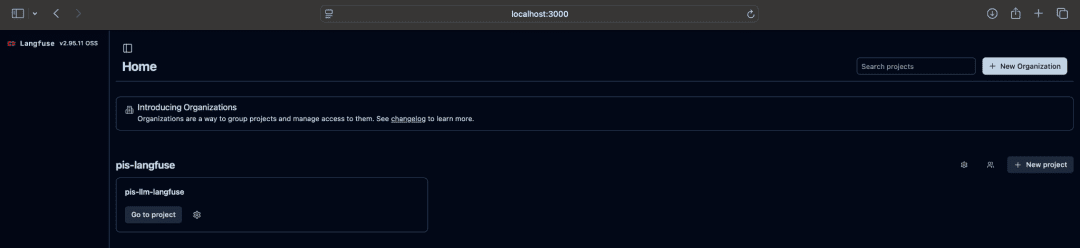
Langfuse UI Home PageRun Your First Traced Pipeline
Now run the decorator-instrumented script:
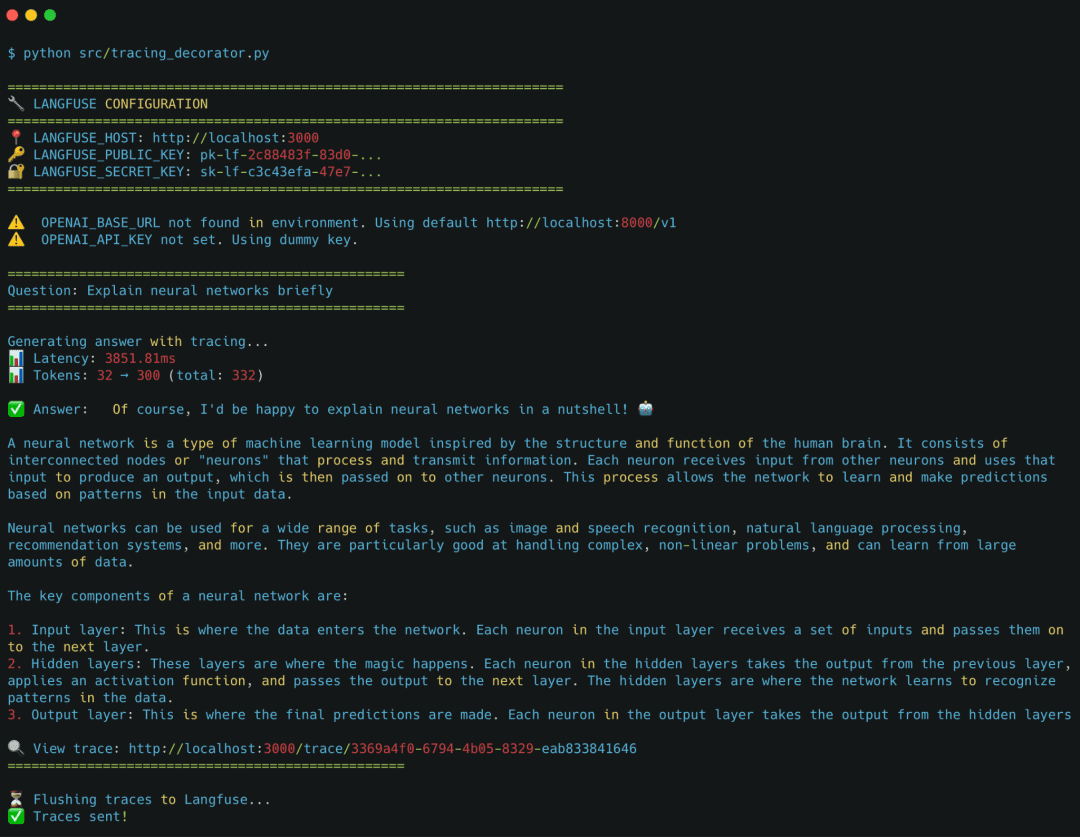
python src/tracing_decorator.py
You should see terminal output like:
==================================================
Question: Explain neural networks briefly
==================================================

Generating answer with tracing...
📊 Latency: 312.45ms
📊 Tokens: 12 → 88 (total: 100)
🔍 View trace: http://localhost:3000/trace/01HXF...

⏳ Flushing traces to Langfuse...
✅ Traces sent!
This confirms:
- the decorator worked
Langfusereceived the trace- the worker processed it
View the Trace in Langfuse
Open the printed URL, for example:
http://localhost:3000/trace/01HXFG23P9...
You will see:
The parent trace
decorator_pipeline
A nested span
generate_answer
Full metadata
- prompt
- output
- latency
- token usage
- model
systemandusermessages
This is the moment where the entire pipeline becomes visible.
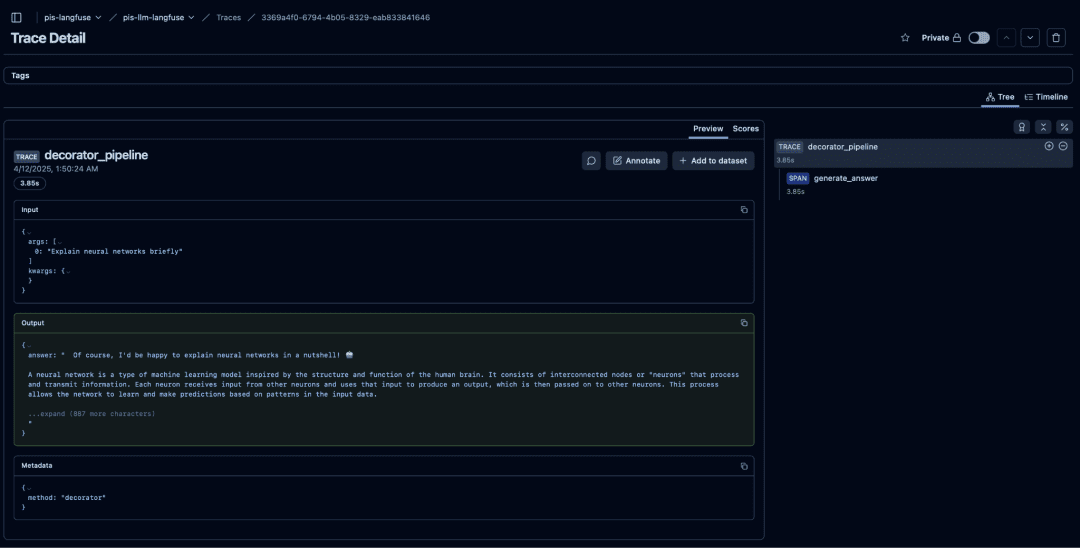
Langfuse trace view showing the full decorator_pipeline execution, including the parent trace, nested generate_answer span, inputs, outputs, and metadata captured automatically via the @observe decorator.Your Observability Stack Is Live
By the end of this section, you now have:
Langfuse Server+Langfuse Worker+PostgreSQLrunning locallyvLLMinference server healthy at port8000- traced LLM requests flowing into the dashboard
- real-time visibility into latency, prompts, outputs, and token usage
This forms the foundation for everything in Lesson 2:
- scores
- evaluations
- diagnostics
- advanced tracing patterns
What's next? We recommend PyImageSearch University.

86+ total classes • 115+ hours hours of on-demand code walkthrough videos • Last updated: July 2026
★★★★★ 4.84 (128 Ratings) • 16,000+ Students Enrolled
I strongly believe that if you had the right teacher you could master computer vision and deep learning.
Do you think learning computer vision and deep learning has to be time-consuming, overwhelming, and complicated? Or has to involve complex mathematics and equations? Or requires a degree in computer science?
That’s not the case.
All you need to master computer vision and deep learning is for someone to explain things to you in simple, intuitive terms. And that’s exactly what I do. My mission is to change education and how complex Artificial Intelligence topics are taught.
If you're serious about learning computer vision, your next stop should be PyImageSearch University, the most comprehensive computer vision, deep learning, and OpenCV course online today. Here you’ll learn how to successfully and confidently apply computer vision to your work, research, and projects. Join me in computer vision mastery.
Inside PyImageSearch University you'll find:
- ✓ 86+ courses on essential computer vision, deep learning, and OpenCV topics
- ✓ 86 Certificates of Completion
- ✓ 115+ hours hours of on-demand video
- ✓ Brand new courses released regularly, ensuring you can keep up with state-of-the-art techniques
- ✓ Pre-configured Jupyter Notebooks in Google Colab
- ✓ Run all code examples in your web browser — works on Windows, macOS, and Linux (no dev environment configuration required!)
- ✓ Access to centralized code repos for all 540+ tutorials on PyImageSearch
- ✓ Easy one-click downloads for code, datasets, pre-trained models, etc.
- ✓ Access on mobile, laptop, desktop, etc.
Summary
In this lesson, you built the core foundation for modern LLM observability. You began by understanding why LLM applications need far more than traditional logs or metrics. They require visibility into prompts, responses, latency, token usage, and multi-step pipelines. This led naturally to Langfuse, a tool purpose-built for tracing and monitoring LLM workloads.
You then deployed a fully self-hosted observability stack using Docker Compose: Langfuse Server, Langfuse Worker, PostgreSQL, and a local vLLM model server. With the project structure, configuration files, and environment variables in place, your development environment became capable of real-time local trace analysis.
Next, you examined your baseline LLM script, a simple “send a question, print an answer” pipeline that works but offers zero visibility. No prompts, no timing, no token counts, and no traceability. This served as the perfect starting point to highlight why observability is essential.
With the Langfuse @observe decorator, you then transformed that invisible pipeline into a fully instrumented one. Every request now captures structured traces: inputs, outputs, latency, token usage, and parent-child spans. Running the script produced your first real trace inside the Langfuse dashboard, revealing exactly what the model did and how the pipeline behaved.
By the end of the lesson, your LLM application evolved from a black box into a transparent, debuggable system running locally with self-hosted components.
In the next lesson, you will go deeper by adding manual tracing, scoring, evaluation logic, latency checks, and health diagnostics, building on the foundation you created today.
Citation Information
Singh, V. “LLM Observability with Self-Hosted Langfuse and vLLM,” PyImageSearch, S. Huot, A. Sharma, and P. Thakur, eds., 2026, https://pyimg.co/tadoh
@incollection{Singh_2026_llm-observability-self-hosted-langfuse-vllm,
  author = {Vikram Singh},
  title = {{LLM Observability with Self-Hosted Langfuse and vLLM}},
  booktitle = {PyImageSearch},
  editor = {Susan Huot and Aditya Sharma and Piyush Thakur},
  year = {2026},
  url = {https://pyimg.co/tadoh},
}
To download the source code to this post (and be notified when future tutorials are published here on PyImageSearch), simply enter your email address in the form below!
Download the Source Code and FREE 17-page Resource Guide
Enter your email address below to get a .zip of the code and a FREE 17-page Resource Guide on Computer Vision, OpenCV, and Deep Learning. Inside you'll find my hand-picked tutorials, books, courses, and libraries to help you master CV and DL!
Comment section
Hey, Adrian Rosebrock here, author and creator of PyImageSearch. While I love hearing from readers, a couple years ago I made the tough decision to no longer offer 1:1 help over blog post comments.
At the time I was receiving 200+ emails per day and another 100+ blog post comments. I simply did not have the time to moderate and respond to them all, and the sheer volume of requests was taking a toll on me.
Instead, my goal is to do the most good for the computer vision, deep learning, and OpenCV community at large by focusing my time on authoring high-quality blog posts, tutorials, and books/courses.
If you need help learning computer vision and deep learning, I suggest you refer to my full catalog of books and courses — they have helped tens of thousands of developers, students, and researchers just like yourself learn Computer Vision, Deep Learning, and OpenCV.
Click here to browse my full catalog.