Today’s blog post is a followup to a tutorial I did a couple of years ago on finding the brightest spot in an image.
My previous tutorial assumed there was only one bright spot in the image that you wanted to detect…
…but what if there were multiple bright spots?
If you want to detect more than one bright spot in an image the code gets slightly more complicated, but not by much. No worries though: I’ll explain each of the steps in detail.
To learn how to detect multiple bright spots in an image, keep reading.
Detecting multiple bright spots in an image with Python and OpenCV
Normally when I do code-based tutorials on the PyImageSearch blog I follow a pretty standard template of:
- Explaining what the problem is and how we are going to solve it.
- Providing code to solve the project.
- Demonstrating the results of executing the code.
This template tends to work well for 95% of the PyImageSearch blog posts, but for this one, I’m going to squash the template together into a single step.
I feel that the problem of detecting the brightest regions of an image is pretty self-explanatory so I don’t need to dedicate an entire section to detailing the problem.
I also think that explaining each block of code followed by immediately showing the output of executing that respective block of code will help you better understand what’s going on.
So, with that said, take a look at the following image:
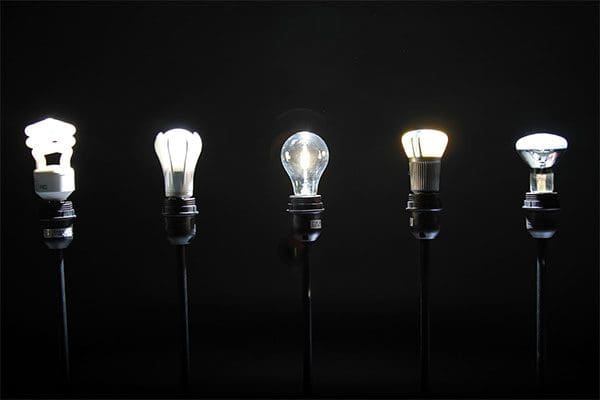
In this image we have five lightbulbs.
Our goal is to detect these five lightbulbs in the image and uniquely label them.
To get started, open up a new file and name it detect_bright_spots.py . From there, insert the following code:
# import the necessary packages
from imutils import contours
from skimage import measure
import numpy as np
import argparse
import imutils
import cv2

# construct the argument parse and parse the arguments
ap = argparse.ArgumentParser()
ap.add_argument("-i", "--image", required=True,
	help="path to the image file")
args = vars(ap.parse_args())
Lines 2-7 import our required Python packages. We’ll be using scikit-image in this tutorial, so if you don’t already have it installed on your system be sure to follow these install instructions.
We’ll also be using imutils, my set of convenience functions used to make applying image processing operations easier.
If you don’t already have imutils installed on your system, you can use pip to install it for you:
$ pip install --upgrade imutils
From there, Lines 10-13 parse our command line arguments. We only need a single switch here, --image , which is the path to our input image.
To start detecting the brightest regions in an image, we first need to load our image from disk followed by converting it to grayscale and smoothing (i.e., blurring) it to reduce high frequency noise:
# load the image, convert it to grayscale, and blur it
image = cv2.imread(args["image"])
gray = cv2.cvtColor(image, cv2.COLOR_BGR2GRAY)
blurred = cv2.GaussianBlur(gray, (11, 11), 0)
The output of these operations can be seen below:
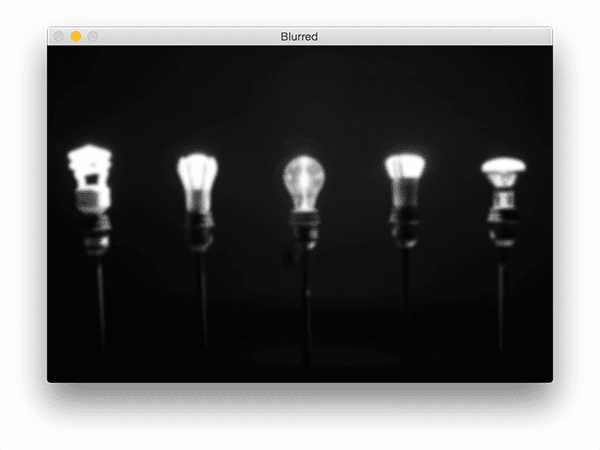
Notice how our image is now (1) grayscale and (2) blurred.
To reveal the brightest regions in the blurred image we need to apply thresholding:
# threshold the image to reveal light regions in the
# blurred image
thresh = cv2.threshold(blurred, 200, 255, cv2.THRESH_BINARY)[1]
This operation takes any pixel value p >= 200 and sets it to 255 (white). Pixel values < 200 are set to 0 (black).
After thresholding we are left with the following image:
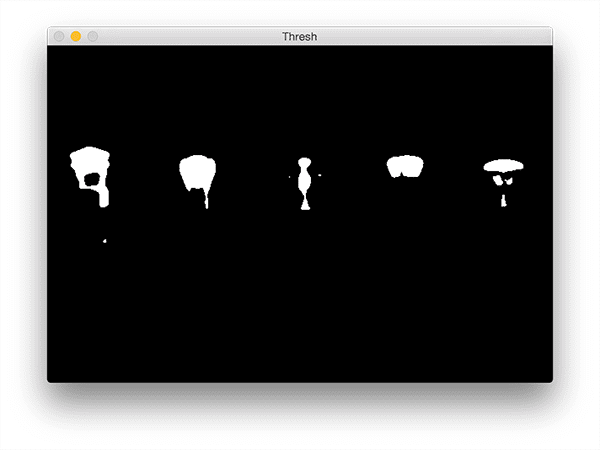
Note how the bright areas of the image are now all white while the rest of the image is set to black.
However, there is a bit of noise in this image (i.e., small blobs), so let’s clean it up by performing a series of erosions and dilations:
# perform a series of erosions and dilations to remove
# any small blobs of noise from the thresholded image
thresh = cv2.erode(thresh, None, iterations=2)
thresh = cv2.dilate(thresh, None, iterations=4)
After applying these operations you can see that our thresh image is much “cleaner”, although we do still have a few left over blobs that we’d like to exclude (we’ll handle that in our next step):
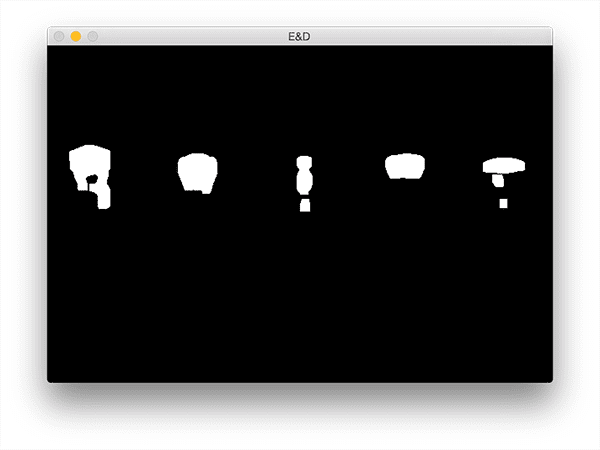
The critical step in this project is to label each of the regions in the above figure; however, even after applying our erosions and dilations we’d still like to filter out any leftover “noisy” regions.
An excellent way to do this is to perform a connected-component analysis:
# perform a connected component analysis on the thresholded
# image, then initialize a mask to store only the "large"
# components
labels = measure.label(thresh, neighbors=8, background=0)
mask = np.zeros(thresh.shape, dtype="uint8")

# loop over the unique components
for label in np.unique(labels):
	# if this is the background label, ignore it
	if label == 0:
		continue

	# otherwise, construct the label mask and count the
	# number of pixels
	labelMask = np.zeros(thresh.shape, dtype="uint8")
	labelMask[labels == label] = 255
	numPixels = cv2.countNonZero(labelMask)

	# if the number of pixels in the component is sufficiently
	# large, then add it to our mask of "large blobs"
	if numPixels > 300:
		mask = cv2.add(mask, labelMask)
Line 32 performs the actual connected-component analysis using the scikit-image library. The labels variable returned from measure.label has the exact same dimensions as our thresh image — the only difference is that labels stores a unique integer for each blob in thresh .
We then initialize a mask on Line 33 to store only the large blobs.
On Line 36 we start looping over each of the unique labels . If the label is zero then we know we are examining the background region and can safely ignore it (Lines 38 and 39).
Otherwise, we construct a mask for just the current label on Lines 43 and 44.
I have provided a GIF animation below that visualizes the construction of the labelMask for each label . Use this animation to help yourself understand how each of the individual components are accessed and displayed:

Line 45 then counts the number of non-zero pixels in the labelMask . If numPixels exceeds a pre-defined threshold (in this case, a total of 300 pixels), then we consider the blob “large enough” and add it to our mask .
The output mask can be seen below:
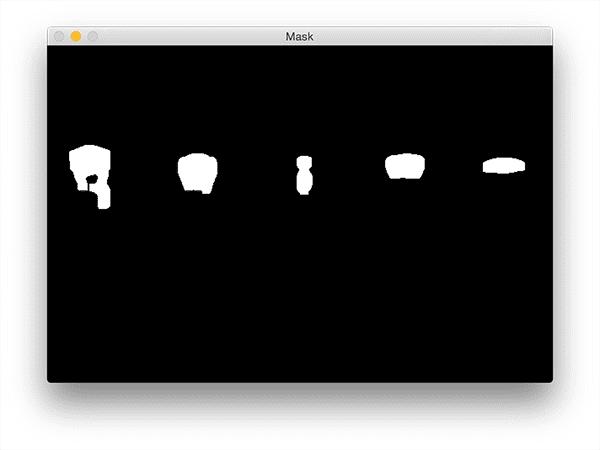
Notice how any small blobs have been filtered out and only the large blobs have been retained.
The last step is to draw the labeled blobs on our image:
# find the contours in the mask, then sort them from left to
# right
cnts = cv2.findContours(mask.copy(), cv2.RETR_EXTERNAL,
	cv2.CHAIN_APPROX_SIMPLE)
cnts = imutils.grab_contours(cnts)
cnts = contours.sort_contours(cnts)[0]

# loop over the contours
for (i, c) in enumerate(cnts):
	# draw the bright spot on the image
	(x, y, w, h) = cv2.boundingRect(c)
	((cX, cY), radius) = cv2.minEnclosingCircle(c)
	cv2.circle(image, (int(cX), int(cY)), int(radius),
		(0, 0, 255), 3)
	cv2.putText(image, "#{}".format(i + 1), (x, y - 15),
		cv2.FONT_HERSHEY_SIMPLEX, 0.45, (0, 0, 255), 2)

# show the output image
cv2.imshow("Image", image)
cv2.waitKey(0)
First, we need to detect the contours in the mask image and then sort them from left-to-right (Lines 54-57).
Once our contours have been sorted we can loop over them individually (Line 60).
For each of these contours we’ll compute the minimum enclosing circle (Line 63) which represents the area that the bright region encompasses.
We then uniquely label the region and draw it on our image (Lines 64-67).
Finally, Lines 70 and 71 display our output results.
To visualize the output for the lightbulb image be sure to download the source code + example images to this blog post using the “Downloads” section found at the bottom of this tutorial.
From there, just execute the following command:
$ python detect_bright_spots.py --image images/lights_01.png
You should then see the following output image:
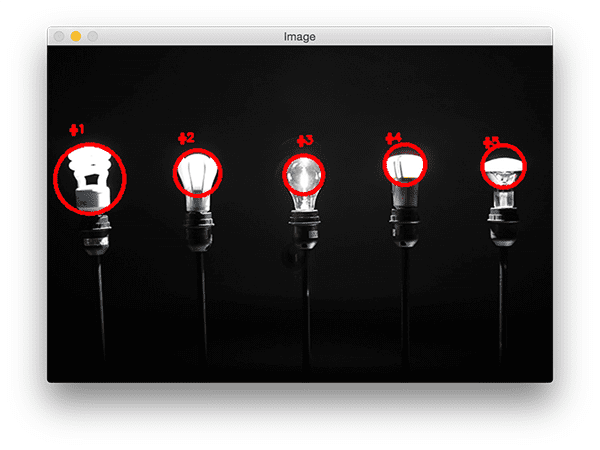
Notice how each of the lightbulbs has been uniquely labeled with a circle drawn to encompass each of the individual bright regions.
You can visualize a a second example by executing this command:
$ python detect_bright_spots.py --image images/lights_02.png
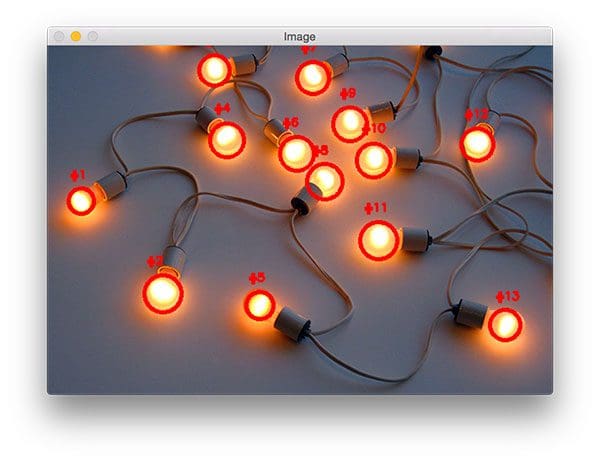
This time there are many lightbulbs in the input image! However, even with many bright regions in the image our method is still able to correctly (and uniquely) label each of them.
What's next? We recommend PyImageSearch University.
86+ total classes • 115+ hours hours of on-demand code walkthrough videos • Last updated: January 2026
★★★★★ 4.84 (128 Ratings) • 16,000+ Students Enrolled
I strongly believe that if you had the right teacher you could master computer vision and deep learning.
Do you think learning computer vision and deep learning has to be time-consuming, overwhelming, and complicated? Or has to involve complex mathematics and equations? Or requires a degree in computer science?
That’s not the case.
All you need to master computer vision and deep learning is for someone to explain things to you in simple, intuitive terms. And that’s exactly what I do. My mission is to change education and how complex Artificial Intelligence topics are taught.
If you're serious about learning computer vision, your next stop should be PyImageSearch University, the most comprehensive computer vision, deep learning, and OpenCV course online today. Here you’ll learn how to successfully and confidently apply computer vision to your work, research, and projects. Join me in computer vision mastery.
Inside PyImageSearch University you'll find:
- ✓ 86+ courses on essential computer vision, deep learning, and OpenCV topics
- ✓ 86 Certificates of Completion
- ✓ 115+ hours hours of on-demand video
- ✓ Brand new courses released regularly, ensuring you can keep up with state-of-the-art techniques
- ✓ Pre-configured Jupyter Notebooks in Google Colab
- ✓ Run all code examples in your web browser — works on Windows, macOS, and Linux (no dev environment configuration required!)
- ✓ Access to centralized code repos for all 540+ tutorials on PyImageSearch
- ✓ Easy one-click downloads for code, datasets, pre-trained models, etc.
- ✓ Access on mobile, laptop, desktop, etc.
Summary
In this blog post I extended my previous tutorial on detecting the brightest spot in an image to work with multiple bright regions. I was able to accomplish this by applying thresholding to reveal the brightest regions in an image.
The key here is the thresholding step — if your thresh map is extremely noisy and cannot be filtered using either contour properties or a connected-component analysis, then you won’t be able to localize each of the bright regions in the image.
Thus, you should take care to assess your input images by applying various thresholding techniques (simple thresholding, Otsu’s thresholding, adaptive thresholding, perhaps even GrabCut) and visualizing your results.
This step should be performed before you even bother applying a connected-component analysis or contour filtering.
Provided that you can reasonably segment the light regions from the darker, irrelevant regions of your image then the method outlined in this blog post should work quite well for you.
Anyway, I hope you enjoyed this blog post!
Before you go, be sure to enter your email address in the form below to be notified when future tutorials are published on the PyImageSearch blog.
Download the Source Code and FREE 17-page Resource Guide
Enter your email address below to get a .zip of the code and a FREE 17-page Resource Guide on Computer Vision, OpenCV, and Deep Learning. Inside you'll find my hand-picked tutorials, books, courses, and libraries to help you master CV and DL!
