Table of Contents
- Training YOLOv12 for Detecting Pothole Severity Using a Custom Dataset
- Introduction
- Dataset and Task Overview
- About the Dataset
- What Are We Detecting?
- Defining Pothole Severity
- Can the Pothole Severity Logic Be Improved?
- Configuring Your Development Environment
- Training YOLOv12 for Pothole Detection
- Configure Your API and Install Dependencies
- Install Dependencies
- Download the Dataset from Roboflow
- Fine-Tune the YOLOv12 Model
- Training Results and Performance Analysis
- Code Walkthrough: Building the Inference Pipeline with YOLOv12
- Model Loader (model_loader.py)
- Utility Functions (utils.py)
- Detection Logic (pothole_detector.py)
- Gradio Interface (app.py)
- Demo: YOLOv12 Pothole Detection in Action
- Summary
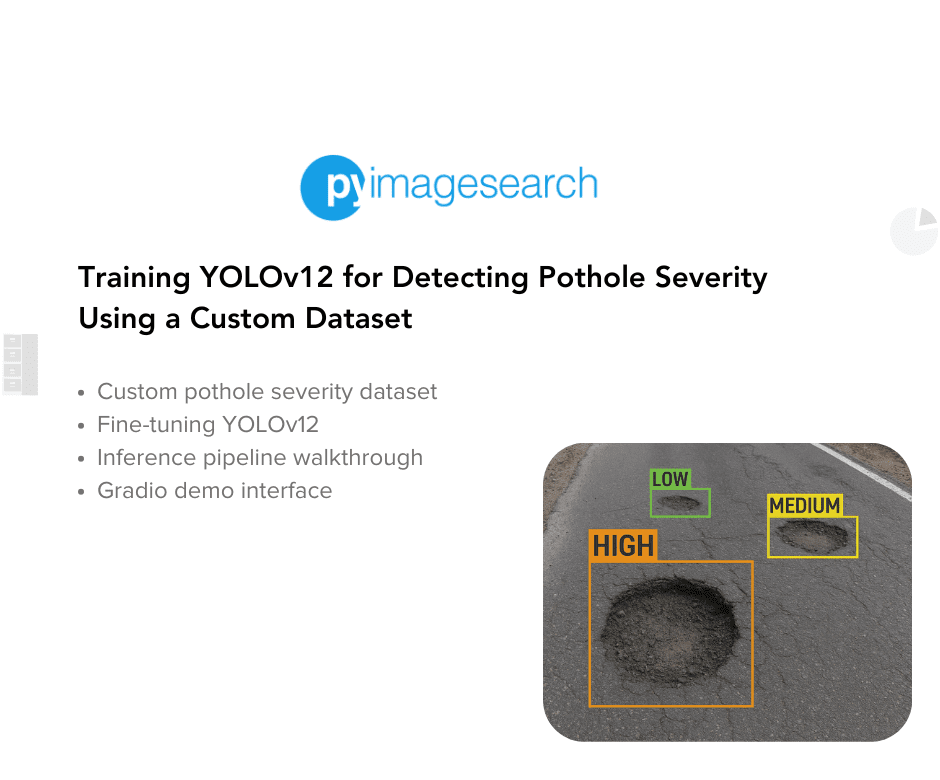
Training YOLOv12 for Detecting Pothole Severity Using a Custom Dataset
In this tutorial, you will learn how to fine-tune YOLOv12 on a custom pothole detection dataset and classify potholes based on severity using bounding box area. You’ll deploy an interactive Gradio UI that allows users to upload images or videos and view both visual detections and a summary table of results.
By the end of this tutorial, you’ll have a fully functional end-to-end pothole detection app — trained and ready to use.
This lesson is the last of a 3-part series on YOLOv12:
- Breaking the CNN Mold: YOLOv12 Brings Attention to Real-Time Object Detection
- People Tracker with YOLOv12 and Centroid Tracker
- Training YOLOv12 for Detecting Pothole Severity Using a Custom Dataset (this tutorial)
To learn how to fine-tune YOLOv12 for pothole detection, classify severity levels, and deploy a Gradio-powered inference app, just keep reading.
Introduction
Cracks and potholes on the road aren’t just a nuisance. They’re a hazard. From damaging vehicles to causing accidents, poorly maintained roads pose a serious safety risk. Traditional inspection methods involve manual surveys, which are time-consuming, expensive, and often ineffective for real-time monitoring.
This is where deep learning steps in — specifically, object detection models that can analyze images or videos of roads and automatically detect potholes. Among the many options available, YOLOv12 stands out as one of the most powerful and efficient models to date. It builds on the success of previous YOLO versions. It incorporates cutting-edge attention mechanisms (e.g., RELAN and Area Attention), making it the first attention-powered YOLO designed for real-time applications.
In this tutorial, we’ll take you beyond just object detection. Our goal is to build a complete pipeline for detecting potholes and estimating their severity using YOLOv12. We’ll measure severity based on the bounding box area of each detected pothole, giving a rough but practical sense of how big or dangerous a pothole is.
But that’s not all. We’ll also:
- Train YOLOv12 on a custom pothole dataset using pre-labeled images
- Build an intuitive Gradio UI that allows users to upload an image or video and instantly get annotated results
- Highlight pothole severity levels directly on the media: Low, Medium, or High
- Optionally save output videos for inspection or recordkeeping
By the end of this post, you’ll have a fully working application — one that could easily be extended to other road damage detection tasks or integrated into mobile or web-based inspection tools.
Let’s get started.
Would you like immediate access to 1,482 images, curated and labeled with potholes, to train, explore, and experiment with, for free? Head over to Roboflow and get a free account to grab these pothole images.
Dataset and Task Overview
To train our YOLOv12 model for pothole detection, we’re using a public dataset from Roboflow’s Pothole Detection collection. This dataset features a diverse set of annotated pothole images captured from real roads, enabling us to fine-tune YOLOv12 on a practical use case.
About the Dataset
- Source: Roboflow Universe
- Dataset Link: Pothole Detection Dataset v2
- Total Images: 1482
- Training: 1037 images
- Validation: 296 images
- Testing: 149 images
- Format: YOLOv12-compatible annotations
- Class: Single class (pothole)
The dataset covers potholes under varying lighting conditions, road textures, and image resolutions. Since the annotations are already in YOLO format, it’s plug-and-play for our fine-tuning workflow.
Figure 1 displays a sample image from the dataset.
What Are We Detecting?
The task is to detect potholes in both images and video streams. Each detection will return a bounding box around the pothole, and in addition, we’ll classify the severity of the pothole using a custom logic.
Defining Pothole Severity
We classify potholes as Low, Medium, or High severity. Instead of using just the bounding box area (which could vary with camera perspective), we adopt a hybrid scoring strategy that accounts for both:
- The size of the pothole (area of the bounding box)
- The position of the pothole in the frame (typically, lower positions suggest the object is closer to the camera).
Both features are normalized using the frame’s height and combined using a weighted score. If a pothole appears large and near the bottom of the frame, it’s more likely to be a serious threat — and thus labeled High severity. Smaller and distant potholes score lower.
This strategy works well when images have roughly consistent resolutions and road-view angles, as is common in dashcam or drone datasets.
Can the Pothole Severity Logic Be Improved?
Yes! While this heuristic is fast and simple, more advanced approaches can be used for greater accuracy:
- Monocular depth estimation using models such as MiDaS (Multiple Depth Estimation Accuracy with Single Network) or DPT (Dense Prediction Transformer) to gauge how far a pothole really is.
- Instance segmentation to get exact pothole boundaries instead of just bounding boxes.
- 3D sensors or stereo vision for capturing physical dimensions.
For this tutorial, we’ll stick to the lightweight scoring logic, which provides a solid trade-off between speed and effectiveness.
Configuring Your Development Environment
Before we dive into training and deploying our YOLOv12 pothole detector, let’s ensure your development environment is properly set up.
You’ll need a Python environment with the following key libraries installed:
opencv-python: For image and video handlinggradio: To build the interactive web UInumpy,scipy,matplotlib: Core scientific libraries- YOLOv12 (cloned directly from the official repo)
Here’s the requirements.txt that we’ll use:
git+https://github.com/sunsmarterjie/yolov12.git
opencv-python
gradio
numpy
matplotlib
scipy
Install them all in one go with:
pip install -r requirements.txt
Once you’re all set, we’ll move on to training YOLOv12 on our pothole dataset.
Need Help Configuring Your Development Environment?
All that said, are you:
- Short on time?
- Learning on your employer’s administratively locked system?
- Wanting to skip the hassle of fighting with the command line, package managers, and virtual environments?
- Ready to run the code immediately on your Windows, macOS, or Linux system?
Then join PyImageSearch University today!
Gain access to Jupyter Notebooks for this tutorial and other PyImageSearch guides pre-configured to run on Google Colab’s ecosystem right in your web browser! No installation required.
And best of all, these Jupyter Notebooks will run on Windows, macOS, and Linux!
Training YOLOv12 for Pothole Detection
In this section, we’ll walk through the full fine-tuning process for YOLOv12 on a custom pothole detection dataset using Roboflow. We’ll also analyze training results using loss curves, evaluation metrics, and prediction visualizations.
Configure Your API and Install Dependencies
To fine-tune YOLOv12, you’ll need a Roboflow API key. Get it from your Roboflow Settings and store it as a Colab Secret under the name ROBOFLOW_API_KEY.
import os
from google.colab import userdata

os.environ["ROBOFLOW_API_KEY"] = userdata.get("ROBOFLOW_API_KEY")
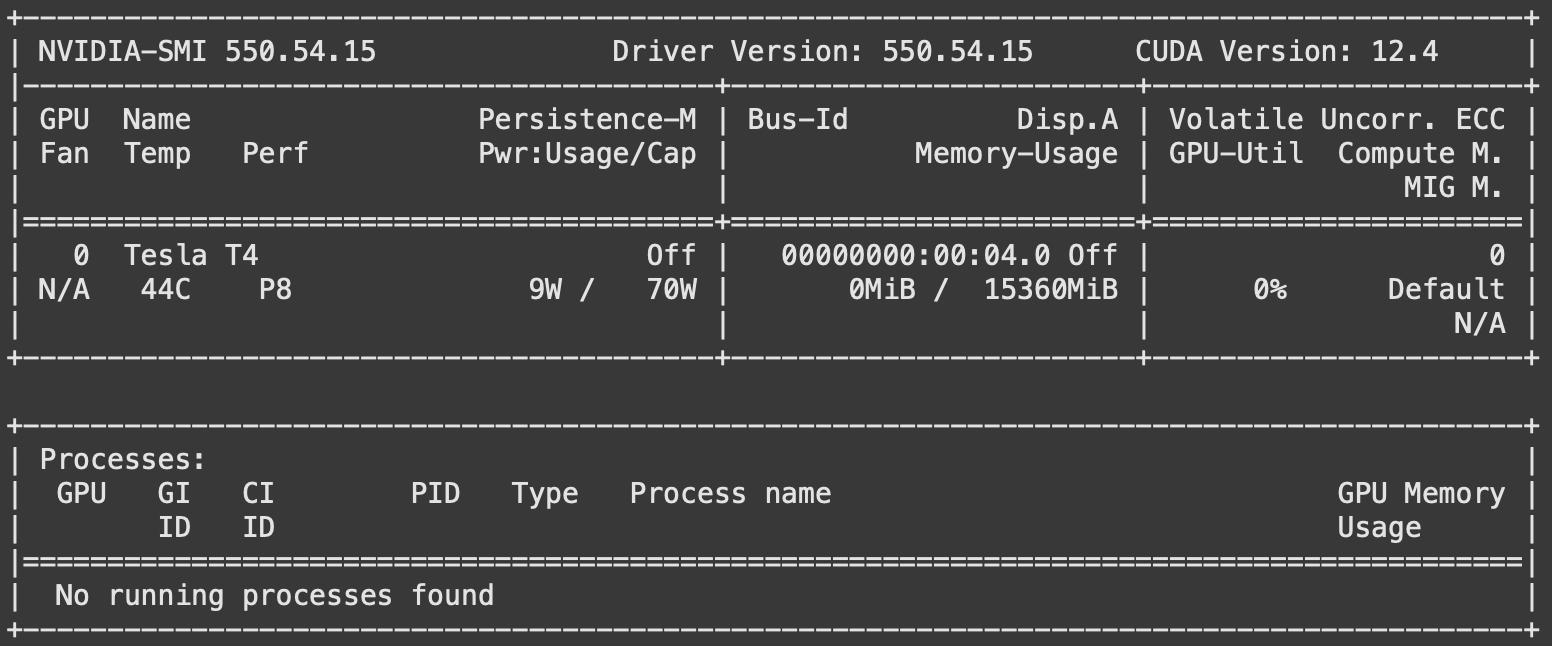
We also check T4 GPU availability in Colab with:
!nvidia-smi
Install Dependencies
We’ll now install the core dependencies required for training and evaluating YOLOv12 on the pothole detection dataset:
!pip install -q git+https://github.com/sunsmarterjie/yolov12.git roboflow supervision
Let’s break down what each package does:
yolov12(via GitHub): Installs the official YOLOv12 repository from Tian et al. (2025) with all required modules for model training, evaluation, and export.roboflow: A utility package from Roboflow that allows you to download datasets hosted on Roboflow Universe programmatically.supervision: A high-level utility library by Roboflow that simplifies object detection pipelines — including annotation, visualization, dataset handling, and mAP evaluation.
Download the Dataset from Roboflow
We use the Roboflow Python SDK (Software Development Kit) to download the dataset in YOLOv12 format:
from roboflow import download_dataset

dataset = download_dataset(
    'https://universe.roboflow.com/aegis/pothole-detection-i00zy/dataset/2',
    'yolov12'
)
Fine-Tune the YOLOv12 Model
Now, let’s train YOLOv12 using ultralytics. We fine-tune the small variant yolov12s.yaml for 50 epochs:
from ultralytics import YOLO

model = YOLO('yolov12s.yaml')
results = model.train(data=f'{dataset.location}/data.yaml', epochs=50)
Training for 50 epochs takes  30 minutes on a T4 GPU. You can try larger variants (e.g.,
 yolov12m, yolov12l, or yolov12x) for better performance (with longer training time).
Training Results and Performance Analysis
Once the YOLOv12 model is fine-tuned on the Roboflow pothole detection dataset, several useful artifacts are generated, including loss curves and a confusion matrix. We also compute the mean average precision with the help of the supervision library. These help us understand how well the model has learned.
Loss and Metric Curves
In Figure 3:
- Box, Classification, and Distributed Focal Loss (DFL) losses (both training and validation) decrease steadily across 50 epochs, indicating healthy convergence.
- Precision and Recall curves consistently improve, indicating the model’s growing ability to detect potholes while minimizing false positives.
- mAP50 and mAP50-95 trends also rise, validating the improved performance across a range of Intersection over Union (IoU) thresholds.
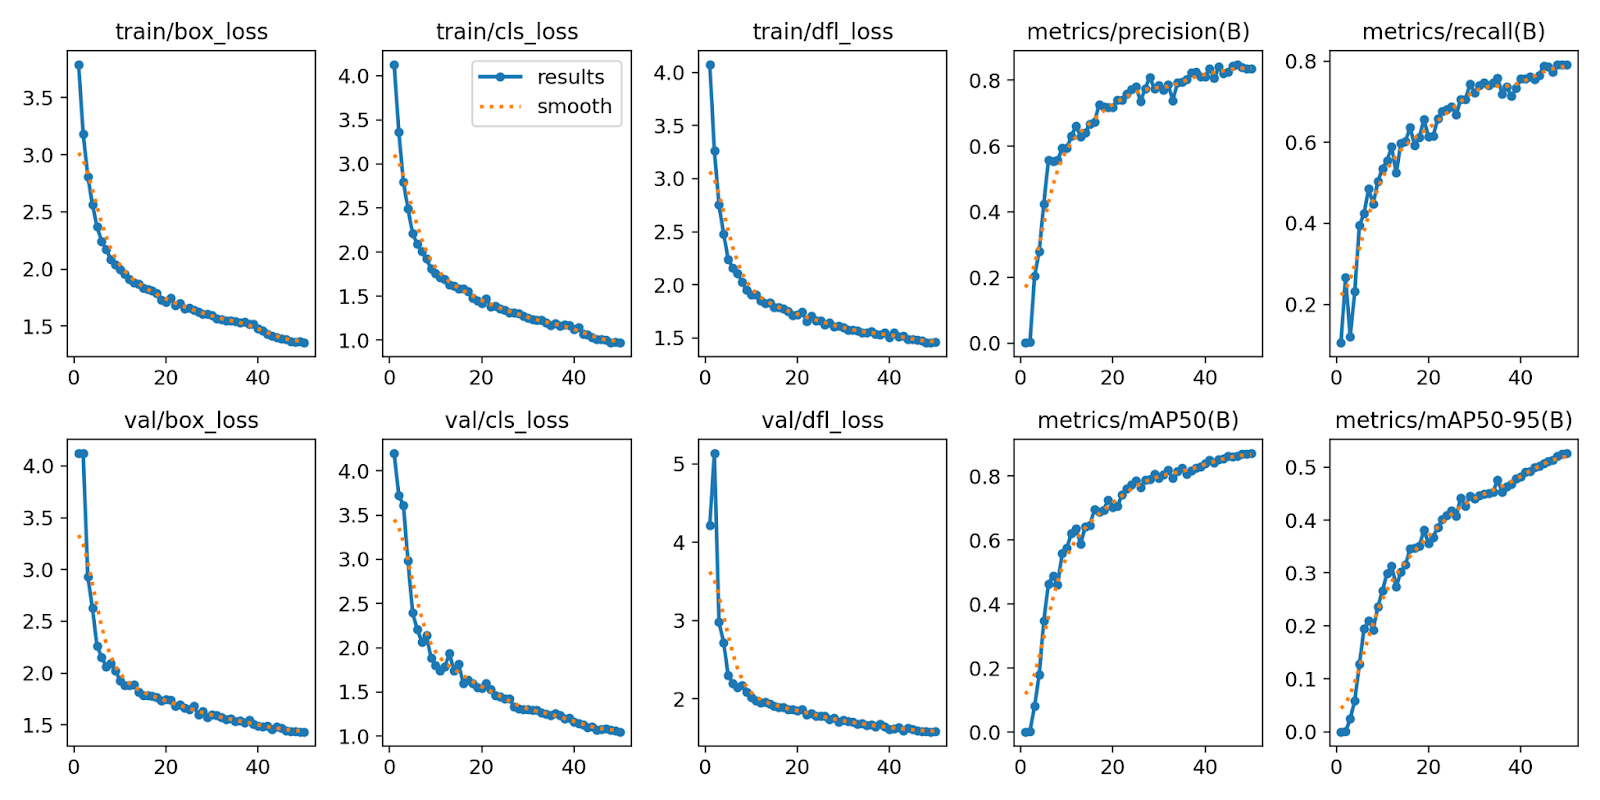
These results suggest that YOLOv12 effectively learns both the object structure and the background in this dataset.
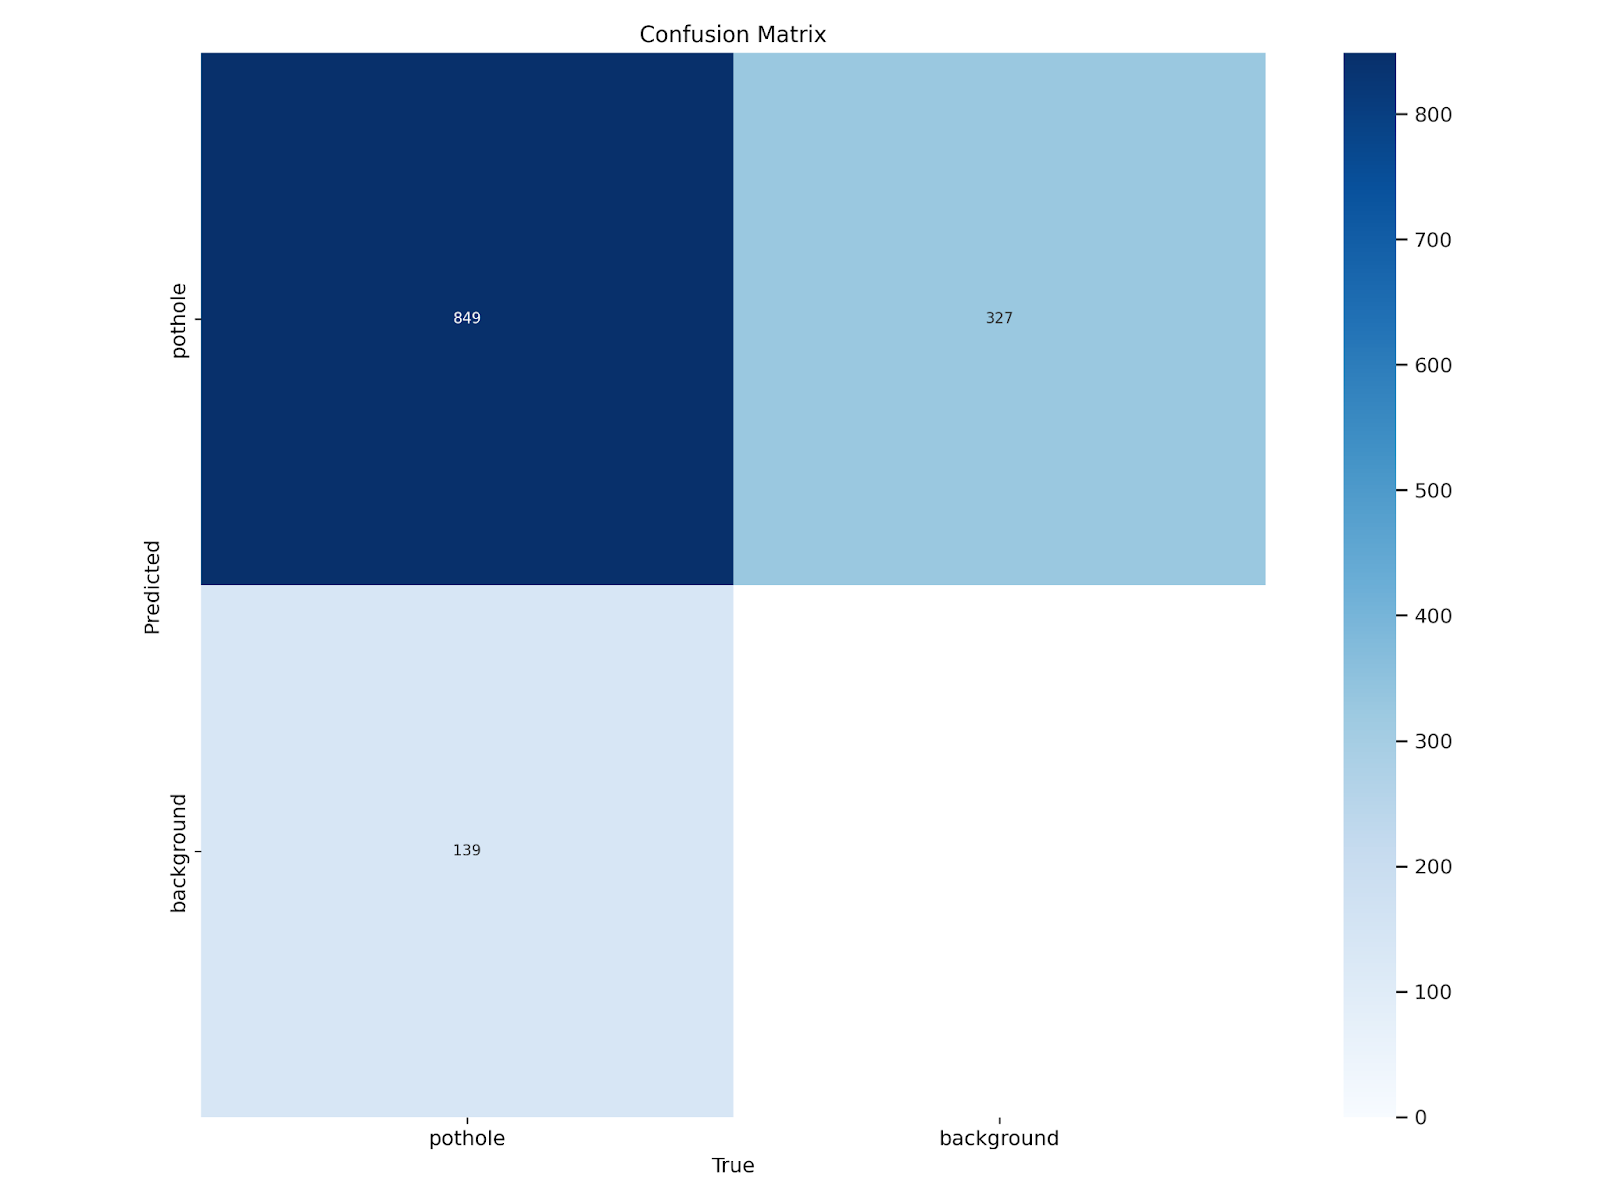
Confusion Matrix
Figure 4 displays a binary setup (pothole vs. background):
- Top-left (849): Correctly predicted potholes (True Positives).
- Top-right (327): Background regions incorrectly labeled as potholes (False Positives).
- Bottom-left (139): Missed potholes (False Negatives).
- Bottom-right: Not meaningful here since we don’t explicitly label “background” in object detection. This value is often inferred or unused.
Mean Average Precision (mAP)
import supervision as sv

ds = sv.DetectionDataset.from_yolo(
    images_directory_path=f"{dataset.location}/test/images",
    annotations_directory_path=f"{dataset.location}/test/labels",
    data_yaml_path=f"{dataset.location}/data.yaml"
)
ds.classes
We begin by using the supervision library to load our test dataset in YOLO format. The DetectionDataset.from_yolo() method conveniently parses the test image directory, label annotations, and data.yaml file to create structured dataset object (ds) that can be directly used for evaluation. The ds.classes line lists the classes present in the dataset — in this case, just the pothole class — helping us verify the label space before computing evaluation metrics (e.g., mAP).
from supervision.metrics import MeanAveragePrecision

model = YOLO(f'/{HOME}/runs/detect/train/weights/best.pt')

predictions = []
targets = []

for _, image, target in ds:
    results = model(image, verbose=False)[0]
    detections = sv.Detections.from_ultralytics(results)
    predictions.append(detections)
    targets.append(target)

map = MeanAveragePrecision().update(predictions, targets).compute()
We begin by importing the MeanAveragePrecision class from the supervision.metrics module and loading the best model checkpoint of our fine-tuned YOLOv12 model. We then iterate over each image and its corresponding ground-truth target in the test dataset.
For each image, we perform inference using the model and convert the output predictions into sv.Detections format for consistency.
These predictions and their corresponding targets are collected into lists. Finally, we utilize the MeanAveragePrecision class to compute evaluation metrics, which include the mAP@50, mAP@75, and mAP@50:95 scores, providing a robust quantitative measure of the model’s accuracy across various IoU thresholds.
Figure 5 presents a granular view of mean Average Precision (mAP) performance across different IoU thresholds and object sizes:
- mAP@50:95: The overall average precision across IoU thresholds from 0.5 to 0.95. In our case, it’s
 0.50, which is quite solid given a real-world dataset.
 - mAP@50: Hits 0.82 — showing that the model is confident in identifying whether a pothole exists.
- mAP@75: Slightly lower (0.55), indicating the model struggles a bit with precise localization at higher IoU thresholds.
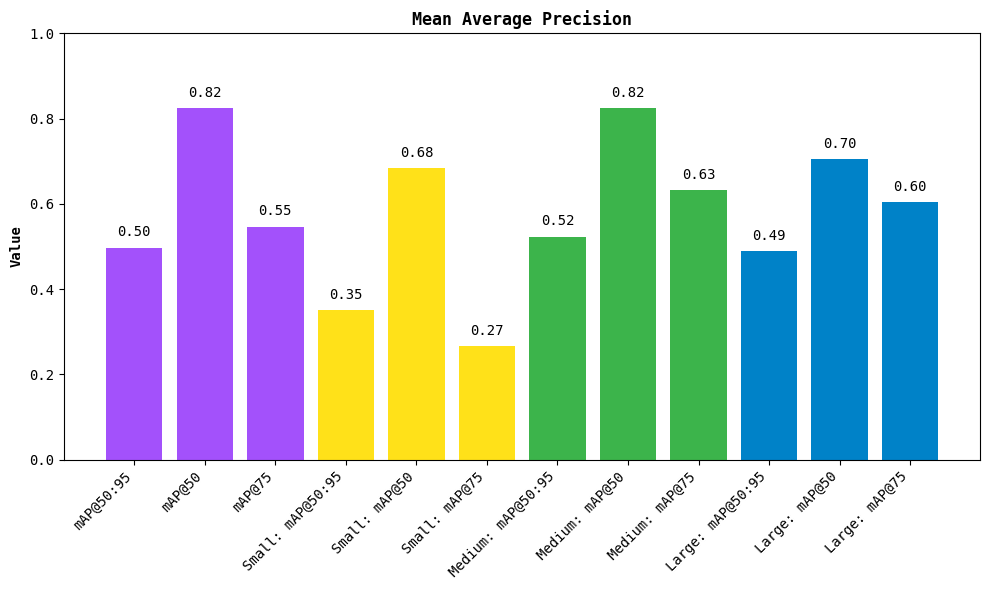
Size-Wise Performances
- Small objects: mAP@50: 0.68 → decent for tiny potholes but with some drop at mAP@75: 0.27
- Medium objects: Best results! mAP@50: 0.82 and mAP@75: 0.63 → model handles average potholes very well
- Large objects: Still good: mAP@50: 0.70, mAP@75: 0.60 → slight dip likely due to fewer large examples in training
These results suggest that YOLOv12 learns well across all sizes but performs best on medium potholes, which are most consistent in terms of size, shape, and visibility.
Code Walkthrough: Building the Inference Pipeline with YOLOv12
Before we deploy our pothole detection application with Gradio, let’s walk through the key components that power the pipeline. Our codebase is cleanly organized into modular scripts to separate model loading, utility functions, core detection logic, and the frontend interface.
Model Loader (model_loader.py)
import os
from ultralytics import YOLO

def load_model(model_path=None):
    model_path = model_path or os.getenv("MODEL_PATH", "fine_tuned_yolov12/best.pt")
    if not os.path.exists(model_path):
        raise FileNotFoundError(f"Model file not found at path: {model_path}")
    return YOLO(model_path)
This script handles loading the YOLOv12 model. We first import the necessary modules and define the load_model function. If a path isn’t provided explicitly, it attempts to load the model from the environment variable MODEL_PATH, defaulting to a local directory. If the file doesn’t exist, it raises a FileNotFoundError. Otherwise, it initializes and returns the YOLO model instance using Ultralytics’ API.
Utility Functions (utils.py)
def get_severity_with_position(area, y_center, frame_height, alpha=0.6):
    vertical_position_norm = y_center / frame_height
    normalized_area = area / (frame_height * frame_height)
    score = alpha * normalized_area + (1 - alpha) * vertical_position_norm

    if score < 0.2:
        return "Low"
    elif score < 0.4:
        return "Medium"
    else:
        return "High"
This function estimates pothole severity using a weighted combination of area and vertical position. We normalize the bounding box area and the vertical position of the pothole’s centroid. The final severity score is a weighted average using the alpha parameter (defaulting to 0.6). Based on this score, the pothole is classified as "Low", "Medium", or "High" severity.
def is_video_file(path):
    return isinstance(path, str) and path.endswith((".mp4", ".avi", ".mov"))
This helper function determines whether a given path corresponds to a video file by checking its extension. It helps us handle input type logic later in the app.
Detection Logic (pothole_detector.py)
Import Statements and Model Loading
import cv2
from pyimagesearch.model_loader import load_model
from pyimagesearch.utils import get_severity_with_position, is_video_file

# load the pretrained model
model = load_model()
This block begins by importing the necessary components. cv2 is used for image and video processing via OpenCV. Then, we import three custom modules:
load_model: to load our YOLOv12 checkpointget_severity_with_position: to estimate pothole severity based on size and positionis_video_file: to identify the input type.
The model is loaded once at the top level to avoid reloading it on every function call, ensuring faster inference.
Helper Function: draw_boxes_and_severity
def draw_boxes_and_severity(frame, boxes):
    for x1, y1, x2, y2 in boxes:
        area = (x2 - x1) * (y2 - y1)
        y_center = (y1 + y2) / 2
        frame_height = frame.shape[0]
        severity = get_severity_with_position(area, y_center, frame_height)

        cv2.rectangle(frame, (int(x1), int(y1)), (int(x2), int(y2)), (0, 255, 0), 2)
        cv2.putText(frame, severity, (int(x1), int(y1) - 10),
                    cv2.FONT_HERSHEY_SIMPLEX, 0.5, (255, 255, 255), 2)

    return frame
This function overlays the bounding boxes and severity labels onto the frame. For each bounding box, it calculates the area and vertical center, then uses these values to call get_severity_with_position, which assigns a severity level ("Low", "Medium", or "High"). The box is drawn using OpenCV’s rectangle method, and the label is rendered just above the top-left corner of the box using putText.
Main Detector Function
def pothole_detector(input_media):
    if input_media is None:
        return None, None
We begin by checking whether any input was provided. If not, we return None values to prevent the app from crashing.
    if is_video_file(input_media):
        cap = cv2.VideoCapture(input_media)
        if not cap.isOpened():
            raise ValueError(f"Error opening video file: {input_media}")

        width = int(cap.get(cv2.CAP_PROP_FRAME_WIDTH))
        height = int(cap.get(cv2.CAP_PROP_FRAME_HEIGHT))
        fps = cap.get(cv2.CAP_PROP_FPS)

        output_video_path = "output_detected.mp4"
        fourcc = cv2.VideoWriter_fourcc(*"mp4v")
        out = cv2.VideoWriter(output_video_path, fourcc, fps, (width, height))
This block of code handles the initialization and setup required for processing video input using OpenCV. First, the function checks whether the uploaded file is a video using the helper function is_video_file. If it is, the video is loaded using cv2.VideoCapture(). To ensure the file is valid and readable, it checks whether the capture object was successfully opened. If not, it raises a ValueError with an appropriate message.
Once the video is opened successfully, the code fetches essential metadata (e.g., width, height, and frames per second (FPS)), using OpenCV’s property getters. These values are needed to encode and save the output video properly. It then sets up the output writer using cv2.VideoWriter, specifying the codec (mp4v), frame size, and FPS to match the input video. The output will be saved as "output_detected.mp4" and used to store the processed frames with pothole annotations.
        frame_idx = 0
        while cap.isOpened():
            ret, frame = cap.read()
            if not ret or frame is None or frame_idx > fps * 10:
                break

            results = model.predict(frame, conf=0.4, classes=[0], verbose=False)
            boxes = results[0].boxes.xyxy.cpu().numpy() if results and results[0].boxes else []
            frame = draw_boxes_and_severity(frame, boxes)

            out.write(frame)
            frame_idx += 1

        cap.release()
        out.release()
        return input_media, output_video_path
This segment performs the actual frame-by-frame inference and processing on the uploaded video. A frame_idx variable is initialized to keep track of how many frames have been processed. The loop continues as long as the video capture object is open.
Inside the loop, each frame is read using cap.read(). If a frame cannot be read (due to the end of the video or a read error), or if the frame is None, or if more than 10 seconds of footage have already been processed (frame_idx > fps * 10), the loop breaks. This 10-second cap is useful for preventing long or heavy processing sessions on large video files.
Each valid frame is passed through the YOLOv12 model using the model.predict() function, where the model is instructed to detect only class 0 (assumed to be the pothole class here), and the confidence threshold is set to 0.4. Detected bounding boxes are extracted and passed along with the frame to draw_boxes_and_severity(), which overlays bounding boxes and severity labels onto the frame.
The processed frame is then written to the output video file using out.write(), and the frame index is incremented. Once all frames are processed or the loop is broken, both the video capture (cap) and writer (out) objects are released to free up system resources. Finally, the function returns both the input video path and the path to the newly generated output video, which contains the annotated results.
    else:
        img = cv2.imread(input_media)
        if img is None:
            return None, None

        results = model.predict(img, conf=0.4, classes=[0], verbose=False)
        boxes = results[0].boxes.xyxy.cpu().numpy() if results and results[0].boxes else []
        img = draw_boxes_and_severity(img, boxes)

        output_image_path = "output_detected.jpg"
        cv2.imwrite(output_image_path, img)

        return input_media, output_image_path
This else block handles the scenario when the uploaded file is an image rather than a video. The image is read using cv2.imread(). If it fails to load properly (i.e., returns None), the function exits early by returning a tuple of None values, indicating failure to process the input.
If the image loads successfully, it is passed through the YOLOv12 model for inference. The predict() method is called with a confidence threshold of 0.4 and restricted to detecting class 0 (potholes). The bounding boxes from the results are extracted in (x1, y1, x2, y2) format. These bounding boxes are then passed to the draw_boxes_and_severity() function, which annotates the image with bounding boxes and severity labels.
After the annotations are added, the modified image is saved locally as "output_detected.jpg" using the cv2.imwrite() function. Finally, both the original input path and the path to the annotated output image are returned, allowing downstream components (e.g., Gradio UI) to preview and serve the results.
Gradio Interface (app.py)
import gradio as gr
from pyimagesearch.pothole_detector import pothole_detector
We import Gradio and our pothole_detector function. This is the entry point for the web interface.
input_file = gr.File(label="upload image or video")
input_preview = gr.Image(label="input preview", interactive=False)
output_preview_image = gr.Image(label="detected image output", interactive=False, visible=False)
output_preview_video = gr.Video(label="detected video output", interactive=False, visible=False)
output_download = gr.File(label="download output", interactive=True)
This block of code defines the key user interface components for the Gradio app, allowing users to interactively upload input media, view results, and download processed outputs. Here’s a breakdown of each element:
input_file: This is a file upload widget labeled"upload image or video". It allows the user to upload either an image or a video file that the model will analyze.input_preview: After a file is uploaded, this component displays a static image preview of the uploaded content (if it’s an image). It is marked asinteractive=False, meaning users cannot manipulate this preview directly.output_preview_image: This is an image display component labeled"detected video output". It shows the processed output when the input is an image. Initially, it is set tovisible=Falseto hide it until an image is processed.output_preview_video: Similar to the image output, this widget displays a video with detection results overlaid. It’s hidden by default (visible=False) and becomes visible only when the input is a video.output_download: This provides a downloadable file output of the processed media, whether it’s an annotated image or a video. Settinginteractive=Trueensures users can click and download the result directly.
Together, these components set up the core visual interface of the application, making it intuitive for users to upload files, preview results, and download final outputs.
with gr.Blocks() as iface:
    gr.Markdown("## 🛣️ pothole detection & severity estimation with yolov12")

    with gr.Row():
        with gr.Column():
            input_file.render()
            input_preview.render()
        with gr.Column():
            output_preview_image.render()
            output_preview_video.render()
            output_download.render()
This code block creates the layout of the Gradio interface using gr.Blocks(). It begins with a markdown title that describes the app. Inside a row, two columns are defined: the left column includes components for uploading an image or video and previewing the input. In contrast, the right column displays the detection output (either as an image or video) and provides a download link. This layout cleanly separates inputs and results for a smoother user experience.
    def process_and_display(input_media):
        if input_media is None:
            return None, gr.update(visible=False), gr.update(visible=False), None

        input_path, output_path = pothole_detector(input_media)

        if output_path.endswith((".mp4", ".avi", ".mov")):
            return input_path, gr.update(value=None, visible=False), gr.update(value=output_path, visible=True), output_path
        else:
            return input_path, gr.update(value=output_path, visible=True), gr.update(value=None, visible=False), output_path

    input_file.change(
        fn=process_and_display,
        inputs=input_file,
        outputs=[input_preview, output_preview_image, output_preview_video, output_download],
    )
This block defines the logic that runs when the user uploads or changes the input file in the Gradio app. The process_and_display function first checks if any input was provided — if not, it hides all outputs. If an input is detected, it runs the pothole_detector function to get both the input and processed output paths.
The function then determines whether the result is a video or an image based on the file extension. If it’s a video, the video output preview is shown, and the image preview is hidden. Conversely, if it’s an image, it shows the image preview and hides the video output. This ensures that the interface dynamically adapts based on the media type.
Finally, the input_file.change(...) method binds this logic to the file input field, so the detection automatically runs and updates the interface each time a new file is uploaded.
if __name__ == "__main__":
    iface.launch(server_name="0.0.0.0")
Finally, the app is launched and made accessible on the local network using 0.0.0.0 as the server name.
Demo: YOLOv12 Pothole Detection in Action
Example 1: Video Input
As shown in Figure 6, we uploaded a short road inspection video. On the right, potholes are detected in each frame and labeled with their severity: High, Medium, or Low. The output video is updated in real time and can be downloaded locally for further inspection or reporting.
Figure 6
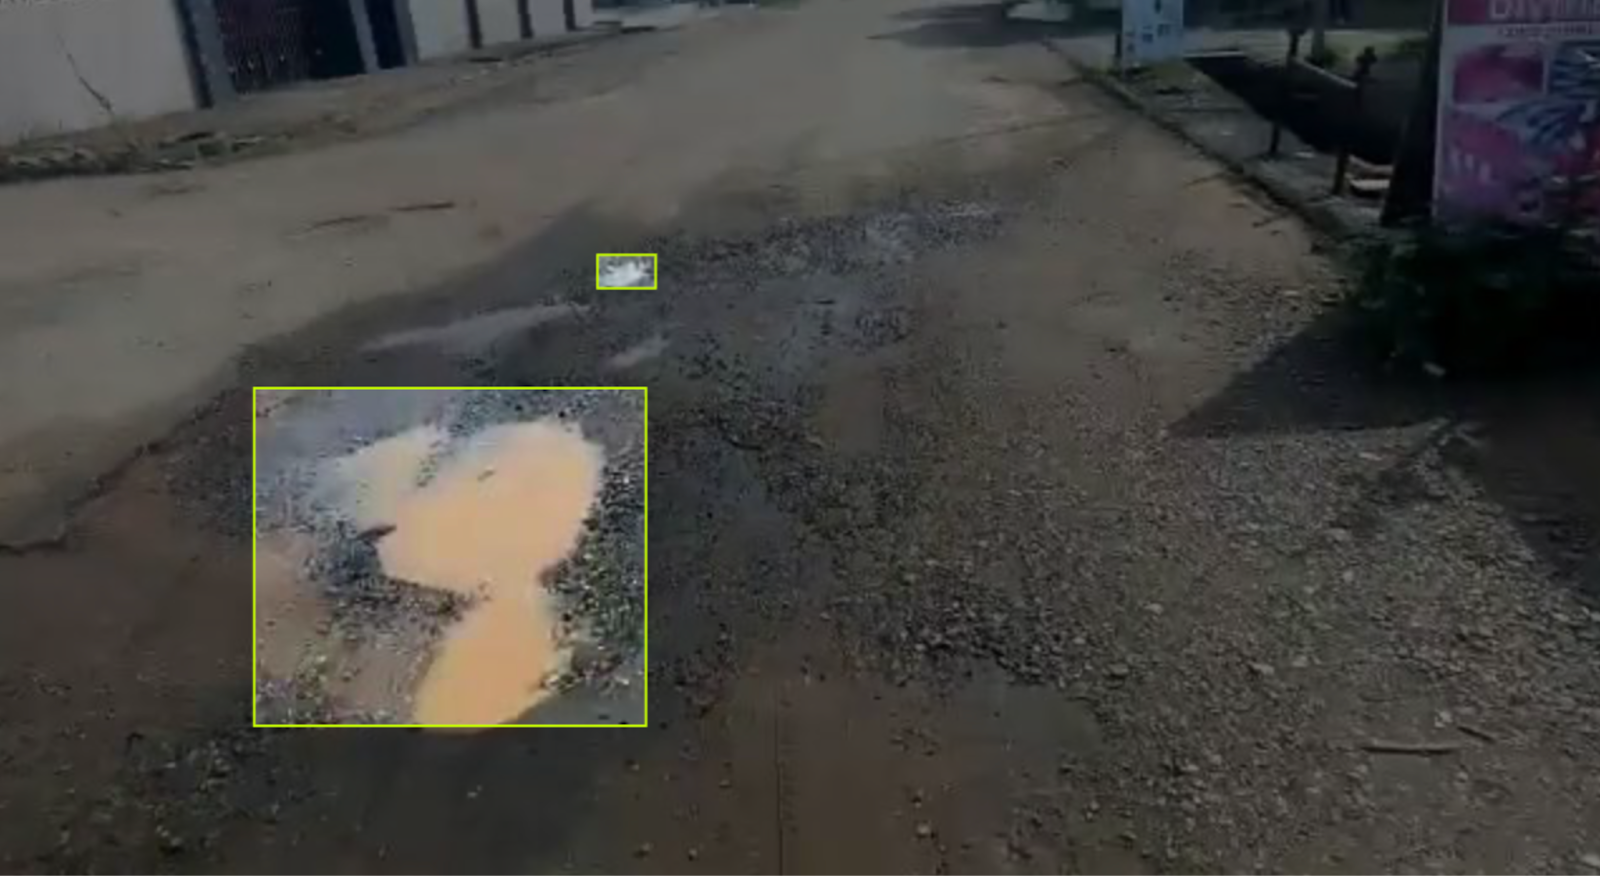
Example 2: Image Input
You can also upload a single road image. In Figure 7, the model accurately highlights all visible potholes and annotates them with severity levels. This lightweight setup makes it easy to run quick visual inspections without needing any post-processing.
Figure 7
What's next? We recommend PyImageSearch University.

86+ total classes • 115+ hours hours of on-demand code walkthrough videos • Last updated: April 2026
★★★★★ 4.84 (128 Ratings) • 16,000+ Students Enrolled
I strongly believe that if you had the right teacher you could master computer vision and deep learning.
Do you think learning computer vision and deep learning has to be time-consuming, overwhelming, and complicated? Or has to involve complex mathematics and equations? Or requires a degree in computer science?
That’s not the case.
All you need to master computer vision and deep learning is for someone to explain things to you in simple, intuitive terms. And that’s exactly what I do. My mission is to change education and how complex Artificial Intelligence topics are taught.
If you're serious about learning computer vision, your next stop should be PyImageSearch University, the most comprehensive computer vision, deep learning, and OpenCV course online today. Here you’ll learn how to successfully and confidently apply computer vision to your work, research, and projects. Join me in computer vision mastery.
Inside PyImageSearch University you'll find:
- ✓ 86+ courses on essential computer vision, deep learning, and OpenCV topics
- ✓ 86 Certificates of Completion
- ✓ 115+ hours hours of on-demand video
- ✓ Brand new courses released regularly, ensuring you can keep up with state-of-the-art techniques
- ✓ Pre-configured Jupyter Notebooks in Google Colab
- ✓ Run all code examples in your web browser — works on Windows, macOS, and Linux (no dev environment configuration required!)
- ✓ Access to centralized code repos for all 540+ tutorials on PyImageSearch
- ✓ Easy one-click downloads for code, datasets, pre-trained models, etc.
- ✓ Access on mobile, laptop, desktop, etc.
Summary
In this tutorial, we fine-tuned YOLOv12 on a real-world pothole detection dataset and built a complete pipeline — from model training and evaluation to interactive deployment with Gradio. We demonstrated how severity estimation can be incorporated using a simple yet effective heuristic, thereby enhancing the application’s informativeness for end users. The final system supports both image and video inputs, returning annotated outputs with bounding boxes and severity labels.
By keeping the setup lightweight and code-driven, we made the application easy to run locally or share with others, ensuring flexibility without additional infrastructure overhead. This project not only highlights the power of YOLOv12 but also serves as a practical template for deploying custom computer vision models with minimal effort.
If you’ve followed along up to now, you’re ready to adapt this workflow to a wide range of object detection tasks — from infrastructure and agriculture to healthcare — and even scale it for real-world applications.
Citation Information
Singh, V. “Training YOLOv12 for Detecting Pothole Severity Using a Custom Dataset,” PyImageSearch, P. Chugh, S. Huot, A. Sharma, and P. Thakur, eds., 2025, https://pyimg.co/stgnl
@incollection{Singh_2025_training-yolov12-for-detecting-pothole-severity-using-custom-dataset,
  author = {Vikram Singh},
  title = {{Training YOLOv12 for Detecting Pothole Severity Using a Custom Dataset}},
  booktitle = {PyImageSearch},
  editor = {Puneet Chugh and Susan Huot and Aditya Sharma and Piyush Thakur},
  year = {2025},
  url = {https://pyimg.co/stgnl},
}
To download the source code to this post (and be notified when future tutorials are published here on PyImageSearch), simply enter your email address in the form below!

Download the Source Code and FREE 17-page Resource Guide
Enter your email address below to get a .zip of the code and a FREE 17-page Resource Guide on Computer Vision, OpenCV, and Deep Learning. Inside you'll find my hand-picked tutorials, books, courses, and libraries to help you master CV and DL!
Comment section
Hey, Adrian Rosebrock here, author and creator of PyImageSearch. While I love hearing from readers, a couple years ago I made the tough decision to no longer offer 1:1 help over blog post comments.
At the time I was receiving 200+ emails per day and another 100+ blog post comments. I simply did not have the time to moderate and respond to them all, and the sheer volume of requests was taking a toll on me.
Instead, my goal is to do the most good for the computer vision, deep learning, and OpenCV community at large by focusing my time on authoring high-quality blog posts, tutorials, and books/courses.
If you need help learning computer vision and deep learning, I suggest you refer to my full catalog of books and courses — they have helped tens of thousands of developers, students, and researchers just like yourself learn Computer Vision, Deep Learning, and OpenCV.
Click here to browse my full catalog.