In this tutorial, you will learn how to use OpenCV and machine learning to automatically detect Parkinson’s disease in hand-drawn images of spirals and waves.
Today’s tutorial is inspired from PyImageSearch reader, Joao Paulo Folador, a PhD student from Brazil.
Joao is interested in utilizing computer vision and machine learning to automatically detect and predict Parkinson’s disease based on geometric drawings (i.e., spirals and sign waves).
While I am familiar with Parkinson’s disease, I had not heard of the geometric drawing test — a bit of research led me to a 2017 paper, Distinguishing Different Stages of Parkinson’s Disease Using Composite Index of Speed and Pen-Pressure of Sketching a Spiral, by Zham et al.
The researchers found that the drawing speed was slower and the pen pressure lower among Parkinson’s patients — this was especially pronounced for patients with a more acute/advanced forms of the disease.
One of the symptoms of Parkinson’s is tremors and rigidity in the muscles, making it harder to draw smooth spirals and waves.
Joao postulated that it might be possible to detect Parkinson’s disease using the drawings alone rather than having to measure the speed and pressure of the pen on paper.
Reducing the requirement of tracking pen speed and pressure:
- Eliminates the need for additional hardware when performing the test.
- Makes it far easier to automatically detect Parkinson’s.
Graciously, Joao and his advisor allowed me access to the dataset they collected of both spirals and waves drawn by (1) patients with Parkinson’s, and (2) healthy participants.
I took a look at the dataset and considered our options.
Originally, Joao wanted to apply deep learning to the project, but after consideration, I carefully explained that deep learning, while powerful, isn’t always the right tool for the job! You wouldn’t want to use a hammer to drive in a screw, for instance.
Instead, you look at your toolbox, carefully consider your options, and grab the right tool.
I explained this to Joao and then demonstrated how we can predict Parkinson’s in images with 83.33% accuracy using standard computer vision and machine learning algorithms.
To learn how to apply computer vision and OpenCV to detect Parkinson’s based on geometric drawings, just keep reading!
You can also join our Machine Learning for Computer Vision Training Program if you’d like the best online computer vision training program.
Detecting Parkinson’s with OpenCV, Computer Vision, and the Spiral/Wave Test
In the first part of this tutorial, we’ll briefly discuss Parkinson’s disease, including how geometric drawings can be used to detect and predict Parkinson’s.
We’ll then examine our dataset of drawings gathered from both patients with and without Parkinson’s.
After reviewing the dataset, I will teach how to use the HOG image descriptor to quantify the input images and then how we can train a Random Forest classifier on top of the extracted features.
We’ll wrap up by examining our results.
What is Parkinson’s disease?

Parkinson’s disease is a nervous system disorder that affects movement. The disease is progressive and is marked by five different stages (source).
- Stage 1: Mild symptoms that do not typically interfere with daily life, including tremors and movement issues on only one side of the body.
- Stage 2: Symptoms continue to become worse with both tremors and rigidity now affecting both sides of the body. Daily tasks become challenging.
- Stage 3: Loss of balance and movements with falls becoming frequent and common. The patient is still capable of (typically) living independently.
- Stage 4: Symptoms become severe and constraining. The patient is unable to live alone and requires help to perform daily activities.
- Stage 5: Likely impossible to walk or stand. The patient is most likely wheelchair bound and may even experience hallucinations.
While Parkinson’s cannot be cured, early detection along with proper medication can significantly improve symptoms and quality of life, making it an important topic as computer vision and machine learning practitioners to explore.
Drawing spirals and waves to detect Parkinson’s disease
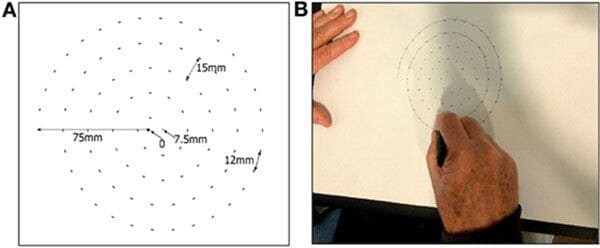
A 2017 study by Zham et al. found that it was possible to detect Parkinson’s by asking the patient to draw a spiral and then track:
- Speed of drawing
- Pen pressure
The researchers found that the drawing speed was slower and the pen pressure lower among Parkinson’s patients — this was especially pronounced for patients with a more acute/advanced forms of the disease.
We’ll be leveraging the fact that two of the most common Parkinson’s symptoms include tremors and muscle rigidity which directly impact the visual appearance of a hand drawn spiral and wave.
The variation in visual appearance will enable us to train a computer vision + machine learning algorithm to automatically detect Parkinson’s disease.
The spiral and wave dataset
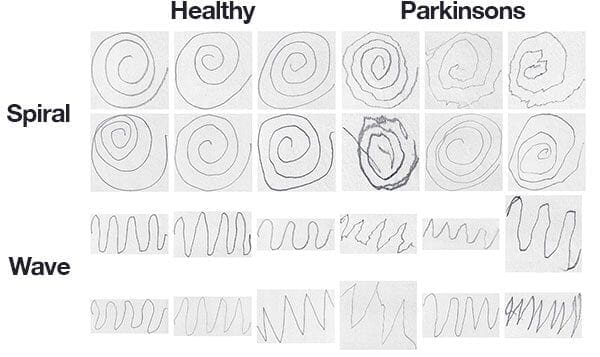
The dataset we’ll be using here today was curated by Adriano de Oliveira Andrade and Joao Paulo Folado from the NIATS of Federal University of Uberlândia.
The dataset itself consists of 204 images and is pre-split into a training set and a testing set, consisting of:
- Spiral: 102 images, 72 training, and 30 testing
- Wave: 102 images, 72 training, and 30 testing
Figure 3 above shows examples of each of the drawings and corresponding classes.
While it would be challenging, if not impossible, for a person to classify Parkinson’s vs. healthy in some of these drawings, others show a clear deviation in visual appearance — our goal is to quantify the visual appearance of these drawings and then train a machine learning model to classify them.
Preparing a computing environment for today’s project
Today’s environment is straightforward to get up and running on your system.
You will need the following software:
- OpenCV
- NumPy
- Scikit-learn
- Scikit-image
- imutils
Each package can be installed with pip, Python’s package manager.
But before you dive into pip, read this tutorial to set up your virtual environment and to install OpenCV with pip.
Below you can find the commands you’ll need to configure your development environment.
$ workon cv # insert your virtual environment name such as `cv`
$ pip install opencv-contrib-python # see the tutorial linked above
$ pip install scikit-learn
$ pip install scikit-image
$ pip install imutils
Project structure
Go ahead and grab today’s “Downloads” associated with today’s post. The .zip file contains the spiral and wave dataset along with a single Python script.
You may use the tree command in a terminal to inspect the structure of the files and folders:
$ tree --dirsfirst --filelimit 10
.
├── dataset
│   ├── spiral
│   │   ├── testing
│   │   │   ├── healthy [15 entries]
│   │   │   └── parkinson [15 entries]
│   │   └── training
│   │       ├── healthy [36 entries]
│   │       └── parkinson [36 entries]
│   └── wave
│       ├── testing
│       │   ├── healthy [15 entries]
│       │   └── parkinson [15 entries]
│       └── training
│           ├── healthy [36 entries]
│           └── parkinson [36 entries]
└── detect_parkinsons.py

15 directories, 1 file
Our dataset/ is first broken down into spiral/ and wave/ . Each of those folders is further split into testing/ and training/ . Finally our images reside in healthy/ or parkinson/ folders.
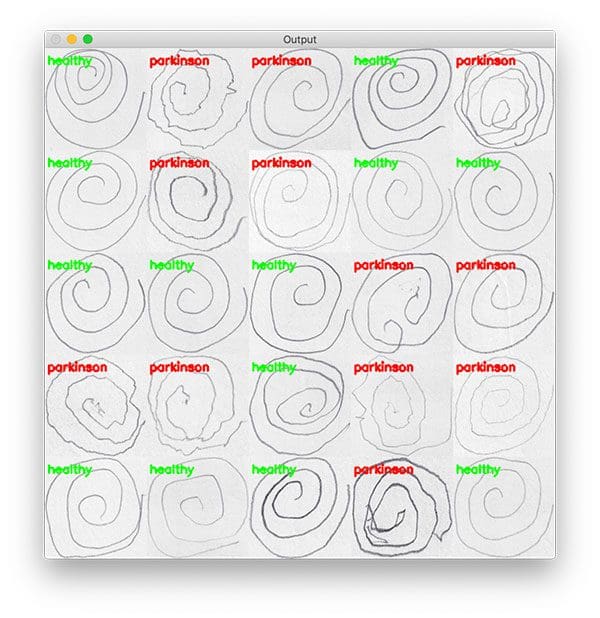
We’ll be reviewing a single Python script today: detect_parkinsons.py . This script will read all of the images, extract features, and train a machine learning model. Finally, results will be displayed in a montage.
Implementing the Parkinson’s detector script
To implement our Parkinson’s detector you may be tempted to throw deep learning and Convolutional Neural Networks (CNNs) at the problem — there’s a problem with that approach though.
To start, we don’t have much training data, only 72 images for training. When confronted with a lack of tracking data we typically apply data augmentation — but data augmentation in this context is also problematic.
You would need to be extremely careful as improper use of data augmentation could potentially make a healthy patient’s drawing look like a Parkinson’s patient’s drawing (or vice versa).
And more to the point, effectively applying computer vision to a problem is all about bringing the right tool to the job — you wouldn’t use a screwdriver to bang in a nail, for instance.
Just because you may know how to apply deep learning to a problem doesn’t necessarily mean that deep learning is “always” the best choice for the problem.
In this example, I’ll show you how the Histogram of Oriented Gradients (HOG) image descriptor along with a Random Forest classifier can perform quite well given the limited amount of training data.
Open up a new file, name it detect_parkinsons.py , and insert the following code:
# import the necessary packages
from sklearn.ensemble import RandomForestClassifier
from sklearn.preprocessing import LabelEncoder
from sklearn.metrics import confusion_matrix
from skimage import feature
from imutils import build_montages
from imutils import paths
import numpy as np
import argparse
import cv2
import os
We begin with our imports on Lines 2-11:
- We’ll be making heavy use of scikit-learn as is evident in the first three imports:
- The classifier we are using is the
RandomForestClassifier. - We’ll use a
LabelEncoderto encode labels as integers. - A
confusion_matrixwill be built so that we can derive raw accuracy, sensitivity, and specificity.
- The classifier we are using is the
- Histogram of Oriented Gradients (HOG) will come from the
featureimport of scikit-image. - Two modules from
imutilswill be put to use:- We will
build_montagesfor visualization. - Our
pathsimport will help us to extract the file paths to each of the images in our dataset.
- We will
- NumPy will help us calculate statistics and grab random indices.
- The
argparseimport will allow us to parse command line arguments. - OpenCV (
cv2) will be used to read, process, and display images. - Our program will accommodate both Unix and Windows file paths with the
osmodule.
Let’s define a function to quantify a wave/spiral image with the HOG method:
def quantify_image(image):
	# compute the histogram of oriented gradients feature vector for
	# the input image
	features = feature.hog(image, orientations=9,
		pixels_per_cell=(10, 10), cells_per_block=(2, 2),
		transform_sqrt=True, block_norm="L1")

	# return the feature vector
	return features
We will extract features from each input image with the quantify_image function.
First introduced by Dalal and Triggs in their CVPR 2005 paper, Histogram of Oriented Gradients for Human Detection, HOG will be used to quantify our image.
HOG is a structural descriptor that will capture and quantify changes in local gradient in the input image. HOG will naturally be able to quantify how the directions of a both spirals and waves change.
And furthermore, HOG will be able to capture if these drawings have more of a “shake” to them, as we might expect from a Parkinson’s patient.
Another application of HOG is this PyImageSearch Gurus sample lesson. Be sure to refer to the sample lesson for a full explanation on the feature.hog parameters.
The resulting features are a 12,996-dim feature vector (list of numbers) quantifying the wave or spiral. We’ll train a Random Forest classifier on top of the features from all images in the dataset.
Moving on, let’s load our data and extract features:
def load_split(path):
	# grab the list of images in the input directory, then initialize
	# the list of data (i.e., images) and class labels
	imagePaths = list(paths.list_images(path))
	data = []
	labels = []

	# loop over the image paths
	for imagePath in imagePaths:
		# extract the class label from the filename
		label = imagePath.split(os.path.sep)[-2]

		# load the input image, convert it to grayscale, and resize
		# it to 200x200 pixels, ignoring aspect ratio
		image = cv2.imread(imagePath)
		image = cv2.cvtColor(image, cv2.COLOR_BGR2GRAY)
		image = cv2.resize(image, (200, 200))

		# threshold the image such that the drawing appears as white
		# on a black background
		image = cv2.threshold(image, 0, 255,
			cv2.THRESH_BINARY_INV | cv2.THRESH_OTSU)[1]

		# quantify the image
		features = quantify_image(image)

		# update the data and labels lists, respectively
		data.append(features)
		labels.append(label)

	# return the data and labels
	return (np.array(data), np.array(labels))
The load_split function has a goal of accepting a dataset path and returning all feature data and associated class labels . Let’s break it down step by step:
- The function is defined to accept a
pathto the dataset (either waves or spirals) on Line 23. - From there we grab input
imagePaths, taking advantage of imutils (Line 26). - Both
dataandlabelslists are initialized (Lines 27 and 28). - From there we loop over all
imagePathsbeginning on Line 31:- Each
labelis extracted from the path (Line 33). - Each
imageis loaded and preprocessed (Lines 37-44). The thresholding step segments the drawing from the input image, making the drawing appear as white foreground on a black background. - Features are extracted via our
quantify_imagefunction (Line 47). - The
featuresandlabelare appended to thedataandlabelslists respectively (Lines 50-51).
- Each
- Finally
dataandlabelsare converted to NumPy arrays and returned conveniently in a tuple (Line 54).
Let’s go ahead and parse our command line arguments:
# construct the argument parser and parse the arguments
ap = argparse.ArgumentParser()
ap.add_argument("-d", "--dataset", required=True,
	help="path to input dataset")
ap.add_argument("-t", "--trials", type=int, default=5,
	help="# of trials to run")
args = vars(ap.parse_args())
Our script handles two command line arguments:
--dataset: The path to the input dataset (either waves or spirals).--trials: The number of trials to run (by default we run5trials).
To prepare for training we’ll perform initializations:
# define the path to the training and testing directories
trainingPath = os.path.sep.join([args["dataset"], "training"])
testingPath = os.path.sep.join([args["dataset"], "testing"])

# loading the training and testing data
print("[INFO] loading data...")
(trainX, trainY) = load_split(trainingPath)
(testX, testY) = load_split(testingPath)

# encode the labels as integers
le = LabelEncoder()
trainY = le.fit_transform(trainY)
testY = le.transform(testY)

# initialize our trials dictionary
trials = {}
Here we are building paths to training and testing input directories (Lines 65 and 66).
From there we load our training and testing splits by passing each path to load_split (Lines 70 and 71).
Our trials dictionary is initialized on Line 79 (recall that by default we will run 5 trials).
Let’s start our trials now:
# loop over the number of trials to run
for i in range(0, args["trials"]):
	# train the model
	print("[INFO] training model {} of {}...".format(i + 1,
		args["trials"]))
	model = RandomForestClassifier(n_estimators=100)
	model.fit(trainX, trainY)

	# make predictions on the testing data and initialize a dictionary
	# to store our computed metrics
	predictions = model.predict(testX)
	metrics = {}

	# compute the confusion matrix and and use it to derive the raw
	# accuracy, sensitivity, and specificity
	cm = confusion_matrix(testY, predictions).flatten()
	(tn, fp, fn, tp) = cm
	metrics["acc"] = (tp + tn) / float(cm.sum())
	metrics["sensitivity"] = tp / float(tp + fn)
	metrics["specificity"] = tn / float(tn + fp)

	# loop over the metrics
	for (k, v) in metrics.items():
		# update the trials dictionary with the list of values for
		# the current metric
		l = trials.get(k, [])
		l.append(v)
		trials[k] = l
On Line 82, we loop over each trial. In each trial, we:
- Initialize our Random Forest classifier and train the model (Lines 86 and 87). For more information about Random Forests, including how they are used in context of computer vision, be sure to refer to PyImageSearch Gurus.
- Make
predictionson testing data (Line 91). - Compute accuracy, sensitivity, and specificity
metrics(Lines 96-100). - Update our
trialsdictionary (Lines 103-108).
Looping over each of our metrics, we’ll print statistical information:
# loop over our metrics
for metric in ("acc", "sensitivity", "specificity"):
	# grab the list of values for the current metric, then compute
	# the mean and standard deviation
	values = trials[metric]
	mean = np.mean(values)
	std = np.std(values)

	# show the computed metrics for the statistic
	print(metric)
	print("=" * len(metric))
	print("u={:.4f}, o={:.4f}".format(mean, std))
	print("")
On Line 111, we loop over each metric .
Then we proceed to grab the values from the trials (Line 114).
Using the values , the mean and standard deviation are computed for each metric (Lines 115 and 116).
From there, the statistics are shown in the terminal.
Now comes the eye candy — we’re going to create a montage so that we can share our work visually:
# randomly select a few images and then initialize the output images
# for the montage
testingPaths = list(paths.list_images(testingPath))
idxs = np.arange(0, len(testingPaths))
idxs = np.random.choice(idxs, size=(25,), replace=False)
images = []

# loop over the testing samples
for i in idxs:
	# load the testing image, clone it, and resize it
	image = cv2.imread(testingPaths[i])
	output = image.copy()
	output = cv2.resize(output, (128, 128))

	# pre-process the image in the same manner we did earlier
	image = cv2.cvtColor(image, cv2.COLOR_BGR2GRAY)
	image = cv2.resize(image, (200, 200))
	image = cv2.threshold(image, 0, 255,
		cv2.THRESH_BINARY_INV | cv2.THRESH_OTSU)[1]
First, we randomly sample images from our testing set (Lines 126-128).
Our images list will hold each wave or spiral image along with annotations added via OpenCV drawing functions (Line 129).
We proceed to loop over the random image indices on Line 132.
Inside the loop, each image is processed in the same manner as during training (Lines 134-142).
From there we’ll automatically classify the image using our new HOG + Random Forest based classifier and add color-coded annotations:
	# quantify the image and make predictions based on the extracted
	# features using the last trained Random Forest
	features = quantify_image(image)
	preds = model.predict([features])
	label = le.inverse_transform(preds)[0]

	# draw the colored class label on the output image and add it to
	# the set of output images
	color = (0, 255, 0) if label == "healthy" else (0, 0, 255)
	cv2.putText(output, label, (3, 20), cv2.FONT_HERSHEY_SIMPLEX, 0.5,
		color, 2)
	images.append(output)

# create a montage using 128x128 "tiles" with 5 rows and 5 columns
montage = build_montages(images, (128, 128), (5, 5))[0]

# show the output montage
cv2.imshow("Output", montage)
cv2.waitKey(0)
Each image is quantified with HOG features (Line 146).
Then the image is classified by passing those features to model.predict (Lines 147 and 148).
The class label is colored green for “healthy” and red otherwise (Line 152). The label is drawn in the top left corner of the image (Lines 153 and 154).
Each output image is then added to an images list (Line 155) so that we can develop a montage (Line 158). You can learn more about creating Montages with OpenCV.
The montage is then displayed via Line 161 until a key is pressed.
Training the Parkinson’s detector model
Let’s put our Parkinson’s disease detector to the test!
Use the “Downloads” section of this tutorial to download the source code and dataset.
From there, navigate to where you downloaded the .zip file, unarchive it, and execute the following command to train our “wave” model:
$ python detect_parkinsons.py --dataset dataset/wave
[INFO] loading data...
[INFO] training model 1 of 5...
[INFO] training model 2 of 5...
[INFO] training model 3 of 5...
[INFO] training model 4 of 5...
[INFO] training model 5 of 5...
acc
===
u=0.7133, o=0.0452

sensitivity
===========
u=0.6933, o=0.0998

specificity
===========
u=0.7333, o=0.0730
Examining our output you’ll see that we obtained 71.33% classification accuracy on the testing set, with a sensitivity of 69.33% (true-positive rate) and specificity of 73.33% (true-negative rate).
It’s important that we measure both sensitivity and specificity as:
- Sensitivity measures the true positives that were also predicted as positives.
- Specificity measures the true negatives that were also predicted as negative.
Machine learning models, especially machine learning models in the medical space, need to take utmost care when balancing true positives and true negatives:
- We don’t want to classify someone as “No Parkinson’s” when they are in fact positive for Parkinson’s.
- And similarly, we don’t want to classify someone as “Parkinson’s positive” when in fact they don’t have the disease.
Let’s now train our model on the “spiral” drawings:
$ python detect_parkinsons.py --dataset dataset/spiral
[INFO] loading data...
[INFO] training model 1 of 5...
[INFO] training model 2 of 5...
[INFO] training model 3 of 5...
[INFO] training model 4 of 5...
[INFO] training model 5 of 5...
acc
===
u=0.8333, o=0.0298

sensitivity
===========
u=0.7600, o=0.0533

specificity
===========
u=0.9067, o=0.0327
This time we reach 83.33% accuracy on the testing set, with a sensitivity of 76.00% and specificity of 90.67%.
Looking at the standard deviations we can also see less significantly less variance and a more compact distribution.
When automatically detecting Parkinson’s disease in hand drawings, at least when utilizing this particular dataset, the “spiral” drawing seems to be much more useful and informative.
What's next? We recommend PyImageSearch University.
86+ total classes • 115+ hours hours of on-demand code walkthrough videos • Last updated: February 2026
★★★★★ 4.84 (128 Ratings) • 16,000+ Students Enrolled
I strongly believe that if you had the right teacher you could master computer vision and deep learning.
Do you think learning computer vision and deep learning has to be time-consuming, overwhelming, and complicated? Or has to involve complex mathematics and equations? Or requires a degree in computer science?
That’s not the case.
All you need to master computer vision and deep learning is for someone to explain things to you in simple, intuitive terms. And that’s exactly what I do. My mission is to change education and how complex Artificial Intelligence topics are taught.
If you're serious about learning computer vision, your next stop should be PyImageSearch University, the most comprehensive computer vision, deep learning, and OpenCV course online today. Here you’ll learn how to successfully and confidently apply computer vision to your work, research, and projects. Join me in computer vision mastery.
Inside PyImageSearch University you'll find:
- ✓ 86+ courses on essential computer vision, deep learning, and OpenCV topics
- ✓ 86 Certificates of Completion
- ✓ 115+ hours hours of on-demand video
- ✓ Brand new courses released regularly, ensuring you can keep up with state-of-the-art techniques
- ✓ Pre-configured Jupyter Notebooks in Google Colab
- ✓ Run all code examples in your web browser — works on Windows, macOS, and Linux (no dev environment configuration required!)
- ✓ Access to centralized code repos for all 540+ tutorials on PyImageSearch
- ✓ Easy one-click downloads for code, datasets, pre-trained models, etc.
- ✓ Access on mobile, laptop, desktop, etc.
Summary
In this tutorial, you learned how to detect Parkinson’s disease in geometric drawings (specifically spirals and waves) using OpenCV and computer vision. We utilized the Histogram of Oriented Gradients image descriptor to quantify each of the input images.
After extracting features from the input images we trained a Random Forest classifier with 100 total decision trees in the forest, obtaining:
- 83.33% accuracy for spiral
- 71.33% accuracy for the wave
It’s also interesting to note that the Random Forest trained on the spiral dataset obtained 76.00% sensitivity, meaning that the model was capable of predicting a true positive (i.e., “Yes, the patient has Parkinson’s”) nearly 76% of the time.
This tutorial serves as yet another example of how computer vision can be applied to the medical domain (click here for more medical tutorials on PyImageSearch).
I hope you enjoyed it and find it helpful when performing your own research or building your own medical computer vision applications.
To download the source code to this post, and be notified when future tutorials are published on PyImageSearch, just enter your email address in the form below!
Download the Source Code and FREE 17-page Resource Guide
Enter your email address below to get a .zip of the code and a FREE 17-page Resource Guide on Computer Vision, OpenCV, and Deep Learning. Inside you'll find my hand-picked tutorials, books, courses, and libraries to help you master CV and DL!

