Table of Contents
- Building Your First Streamlit App: Uploads, Charts, and Filters (Part 1)
- Introduction: Why This Lesson Matters and What You’ll Build
- Why a Data Explorer First?
- Target User Experience: What You’ll Build
- Configuring Your Development Environment
- Project Structure Recap: Extending the Foundation from Lesson 1
- Helper Modules Refresher: Understanding the Data and Visualization Utilities
- Applying a Custom Theme: Adding a Touch of Polish
- Building the Lesson 2 App: Overview Page
- Explore Page: Interactive Scatter Plot
- Citation Information
Building Your First Streamlit App: Uploads, Charts, and Filters (Part 1)
In this tutorial, you’ll learn how to transform a simple Streamlit script into a powerful data-exploration tool. You’ll create an app that loads and profiles datasets, visualizes patterns interactively, and filters results for export — no JavaScript required.
This lesson is part of a series on Streamlit Apps:
- Getting Started with Streamlit: Learn Widgets, Layouts, and Caching
- Building Your First Streamlit App: Uploads, Charts, and Filters (Part 1) (this tutorial)
- Building Your First Streamlit App: Uploads, Charts, and Filters (Part 2)
- Integrating Streamlit with Snowflake for Live Cloud Data Apps (Part 1)
- Integrating Streamlit with Snowflake for Live Cloud Data Apps (Part 2)
To learn how to upload, explore, visualize, and export data seamlessly with Streamlit, just keep reading.
Introduction: Why This Lesson Matters and What You’ll Build
In the initial lesson, you explored the fundamentals of Streamlit: how it reacts to user inputs, reruns scripts top-to-bottom, and turns ordinary Python code into interactive web apps with just a few lines. You built a small playground that displayed text, widgets, and charts. It was simple — but it proved one of Streamlit’s core superpowers: rapid iteration.
In this lesson, you’ll take the next big step. You’ll transform that minimal playground into a fully-functional data-exploration app — the kind of tool you could actually hand to a teammate or client. Instead of hard-coded data, your app will let users upload CSVs, visualize features interactively, and export filtered slices for downstream analysis.
This is where Streamlit starts feeling like a true low-code framework for data science. You’ll see how to combine layout controls, caching, and session state into an elegant workflow that supports multiple pages — all inside a single Python file. Along the way, you’ll build a pattern you can reuse for dashboards, model monitoring tools, or internal analytics portals.
By the end of this tutorial, you’ll understand how to:
- Design clear navigation for multi-section apps.
- Cache expensive operations for snappy performance.
- Manage user uploads and preserve state between interactions.
- Generate on-demand plots, histograms, and exports.
Think of this as your Streamlit “hello world” for real projects — a practical foundation you’ll extend in an upcoming lesson when we connect live data from Snowflake.
Why a Data Explorer First?
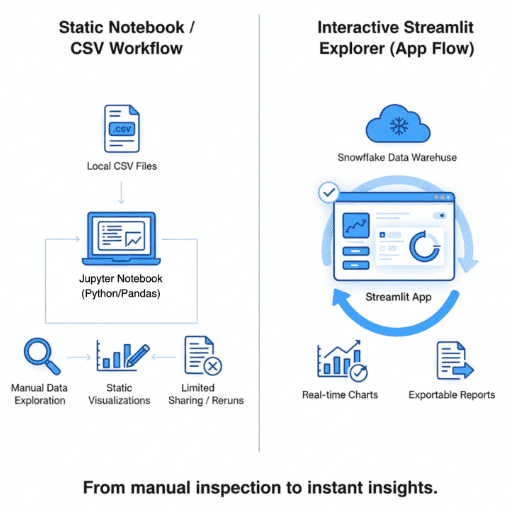
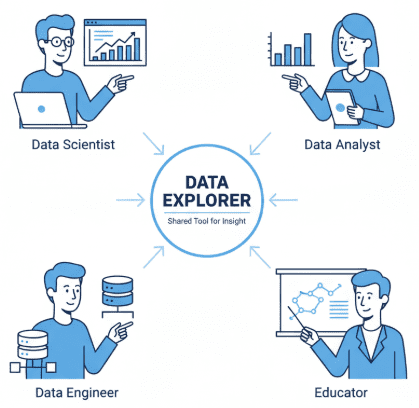
Before diving into models, dashboards, or Snowflake connections, every data project starts with one universal step — understanding the data. Whether you’re a data scientist validating feature engineering, an analyst cleaning up raw CSVs, or an ML engineer checking for drift, you always need a fast, reliable way to see your dataset.
The “data explorer” pattern is the most versatile foundation for that. It’s simple enough for quick experiments but powerful enough to become a reusable internal tool. With just a few Streamlit primitives — file uploads, charts, and caching — you can build a lightweight interface that saves hours of notebook tinkering and email back-and-forth.
Streamlit excels here because it removes the friction between code and insight. You can connect your favorite libraries (e.g., pandas, Altair, matplotlib) directly to UI widgets, letting teammates interact with your logic without touching code. Instead of sharing static reports, you share an app: users explore, slice, and export on their own terms.
This lesson focuses on that sweet spot — a compact yet real-world example that showcases why Streamlit has become a go-to for analytics and ML prototyping alike.
Target User Experience: What You’ll Build
Before writing a single line of code, it’s helpful to visualize the end goal. By the end of this lesson, your Streamlit app will feel like a mini data-analysis hub — not just a static demo.
Here’s what a user (or teammate) will be able to do:
- Land on an Overview Page to preview the dataset and confirm its structure.
- Explore relationships between variables using an interactive scatter plot built with Altair.
- Upload a custom CSV to replace the default Iris sample, instantly refreshing all linked visuals.
- Profile the dataset to see key statistics, missing values, and data types.
- Visualize data in multiple formats — line, bar, scatter, and histogram — from a single dropdown.
- Filter numeric columns interactively with a range slider to focus on specific subsets.
- Export filtered results as a downloadable CSV for further analysis.
All of this happens inside one Python file, thanks to Streamlit’s reactive rerun model and smart caching. You won’t write a single line of JavaScript, handle routes, or define templates.
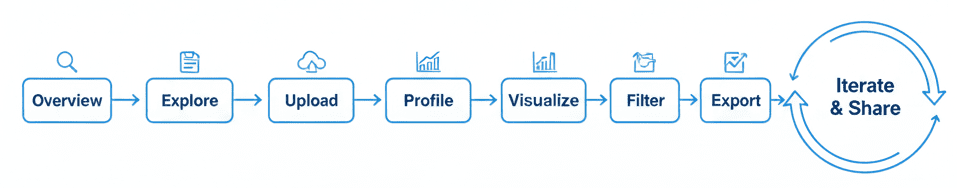
By structuring the app as distinct pages (Overview → Explore → Upload → Profile → Visualize → Filter → Export), you’ll also build a mental model for scaling Streamlit apps in later lessons.
Would you like immediate access to 3,457 images curated and labeled with hand gestures to train, explore, and experiment with … for free? Head over to Roboflow and get a free account to grab these hand gesture images.
Configuring Your Development Environment
To follow this guide, you need to have Streamlit and a few supporting libraries installed on your system.
Luckily, Streamlit is pip-installable and works on all major platforms.
$ pip install "streamlit>=1.38,<2" "pandas>=2.2,<3" altair>=5.2,<6
Once installed, verify everything is set up correctly:
$ python -c "import streamlit, pandas; print(streamlit.__version__, pandas.__version__)"
You should see version numbers printed in your terminal, confirming that your environment is ready.
Need Help Configuring Your Development Environment?
All that said, are you:
- Short on time?
- Learning on your employer’s administratively locked system?
- Wanting to skip the hassle of fighting with the command line, package managers, and virtual environments?
- Ready to run the code immediately on your Windows, macOS, or Linux system?
Then join PyImageSearch University today!
Gain access to Jupyter Notebooks for this tutorial and other PyImageSearch guides pre-configured to run on Google Colab’s ecosystem right in your web browser! No installation required.
And best of all, these Jupyter Notebooks will run on Windows, macOS, and Linux!
Project Structure Recap: Extending the Foundation from Lesson 1
In the previous lesson, we created a clean, modular project layout — a single Streamlit script supported by helper modules for configuration and data loading. That foundation remains the same in the current lesson; we are simply expanding its reach.
Here’s the complete structure again (with new pieces highlighted):
streamlit_project/
├── lesson1_main.py
├── lesson2_main.py          # New app for this lesson
├── lesson3_main.py
├── pyimagesearch/
│   ├── __init__.py
│   ├── config.py
│   ├── data_loader.py
│   ├── visualization.py     # New helper used here
│   ├── snowflake_utils.py   # Lesson 3 only
│   └── utils.py
├── data/
│   └── iris_sample.csv
├── .streamlit/
│   ├── config.toml          # We start using this for theming
│   └── secrets.toml         # For Snowflake (next lesson)
├── requirements.txt
└── README.md
This lesson primarily touches:
lesson2_main.py: our main app file featuring multiple pages and widgets.pyimagesearch/visualization.py: adds reusable plotting and profiling utilities..streamlit/config.toml: introduces a visual theme for polish.
The remaining files (i.e., data_loader.py, config.py, and __init__.py) continue to provide configuration and data-access helpers from the initial lesson. Keeping these modules consistent ensures every lesson builds naturally on the last.
Helper Modules Refresher: Understanding the Data and Visualization Utilities
Before diving into lesson2_main.py, let’s revisit the lightweight helper modules that quietly power the app. These modules keep the main Streamlit file clean and modular, separating concerns between configuration, data access, and visualization.
pyimagesearch/data_loader.py: Reading and Reusing Datasets
This module abstracts away file-reading logic so you can reuse the same loader across all lessons.
from functools import lru_cache
import pandas as pd
from typing import Optional, IO
The imports are minimal:
pandasfor reading CSV files.lru_cachefromfunctoolsfor simple in-memory caching — so if you reload the same file repeatedly (after each rerun), it isn’t re-read from disk every time.- Type hints (
Optional,IO) help editors like VS Code provide autocomplete and static checks.
@lru_cache(maxsize=1)
def load_iris_sample(path: str) -> pd.DataFrame:
    return pd.read_csv(path)
This function reads the bundled Iris sample dataset.
The @lru_cache(maxsize=1) decorator ensures that, even though Streamlit reruns your script on every widget change, the CSV is loaded only once per Python process.
If you switch datasets or restart the app, the cache resets automatically.
def load_uploaded_csv(file_obj: IO[bytes]) -> pd.DataFrame:
    return pd.read_csv(file_obj)
This second helper handles arbitrary CSV uploads from the app. It accepts a file-like object returned by st.file_uploader and reads it directly into a DataFrame. No caching is used here — each uploaded file is unique, and caching by file object could mix results between users or sessions.
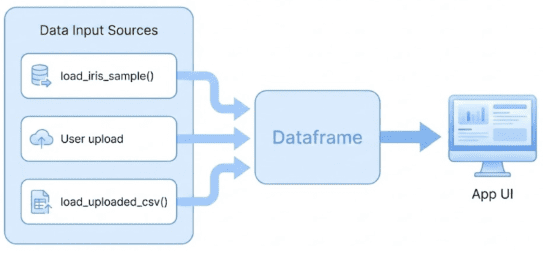
load_iris_sample() or a custom CSV upload via load_uploaded_csv() — both feed into a shared DataFrame that drives the App UI (source: image by the author).pyimagesearch/visualization.py: Reusable Charts and Profiles
Next comes the module that brings data to life.
import altair as alt
import pandas as pd
Altair is a declarative charting library built on Vega-Lite. It integrates perfectly with Streamlit, generating responsive charts without manual JavaScript code.
def iris_feature_scatter(df: pd.DataFrame, x: str, y: str, color: str = "species"):
    chart = (
        alt.Chart(df)
        .mark_circle(size=80, opacity=0.6)
        .encode(
            x=alt.X(x, title=x.replace("_", " ")),
            y=alt.Y(y, title=y.replace("_", " ")),
            color=color,
            tooltip=[x, y, color],
        )
        .interactive()
    )
    return chart
This helper produces the interactive scatter plot used on the Explore page.
It takes column names for x, y, and color encodings, builds an Altair chart, and returns it for display with st.altair_chart.
mark_circle() specifies visual shape; tooltip ensures each point reveals its data when hovered; and .interactive() enables pan / zoom out of the box.
Notice how the function keeps presentation logic isolated — if you decide to swap Altair for Plotly later, you’d only edit this helper.
def dataframe_profile(df: pd.DataFrame) -> pd.DataFrame:
    summary = df.describe(include="all").transpose()
    summary["missing_pct"] = 100 * (1 - summary["count"] / len(df))
    return summary
dataframe_profile() creates a lightweight statistical summary of any DataFrame.
It calls describe() to compute descriptive stats, transposes the result so each column appears as a row, and adds a new missing_pct column showing missing-value percentages.
This summary table powers the Profile and Upload pages.
pyimagesearch/config.py: Centralized Settings
from dataclasses import dataclass
import os
config.py stores constants and configuration logic that multiple lessons reuse.
For this lesson, only one field matters:
default_sample_path: str = os.path.join("data", "iris_sample.csv")
All other fields relate to Snowflake connectivity and will come into play in an upcoming lesson.
By centralizing even small values here, your Streamlit scripts stay declarative and clean.
pyimagesearch/__init__.py: Convenient Imports
from .config import settings
from .data_loader import load_iris_sample, load_uploaded_csv
from .visualization import iris_feature_scatter, dataframe_profile
This __init__.py lets you import everything from the package root:
from pyimagesearch import (
    settings, load_iris_sample, load_uploaded_csv,
    iris_feature_scatter, dataframe_profile
)
This is purely ergonomic (i.e., no logic, no overhead), just convenient namespace management.
Together, these helpers make lesson2_main.py almost read like pseudocode:
Load data → visualize → filter → export.
Each function does one thing well, and the whole app remains readable and maintainable.
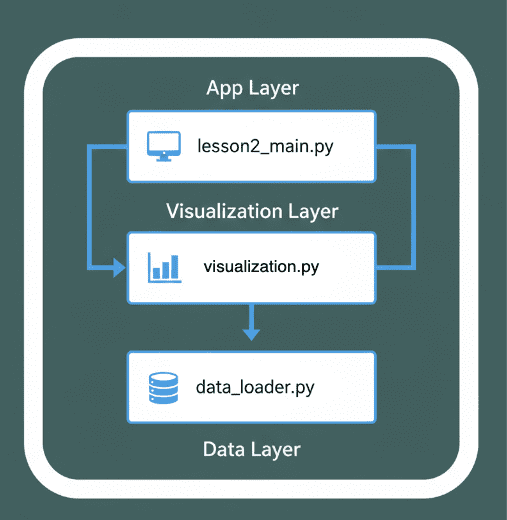
lesson2_main.py) interacts with the visualization module (visualization.py) and data handling logic (data_loader.py). The flow illustrates a clean separation between the App Layer, Visualization Layer, and Data Layer for modular and maintainable design (source: image by the author).Applying a Custom Theme: Adding a Touch of Polish
Before we dive into the full Streamlit app, let’s make it look a bit more professional. By default, Streamlit uses a light theme, but with just a few lines of configuration, you can completely restyle your app.
Theming in Streamlit is controlled through a simple TOML file stored in the .streamlit/ directory. This allows you to customize the background, text, and accent colors globally, with no CSS required.
Creating the Theme File
Inside your project root, create a folder named .streamlit if it doesn’t already exist, and then add a new file called config.toml:
[theme]
base = "dark"
primaryColor = "#FF4B4B"
backgroundColor = "#0E1117"
secondaryBackgroundColor = "#262730"
textColor = "#FAFAFA"
This configuration applies a modern dark theme:
base: switches the entire app to dark mode.primaryColor: defines the accent (button and highlight) color.backgroundColorandsecondaryBackgroundColor: control the page and sidebar colors.textColor: sets the foreground font color for all widgets and labels.
How Streamlit Loads It
Streamlit automatically detects and applies the .streamlit/config.toml file when you run:
streamlit run lesson2_main.py
No additional imports or code changes are needed.
This is ideal because the theming stays purely declarative — you can tweak colors, fonts, or layout behavior without touching your Python scripts.
Tip: Extend the Theme
You can also set other UI-wide parameters here (e.g., page layout and font style):
[server]
headless = true
enableCORS = false

[client]
toolbarMode = "minimal"
These options can be useful when deploying to cloud environments or embedding the app into internal dashboards (review CORS settings carefully for your security requirements).
By now, your app feels far more cohesive — dark backgrounds make data tables and charts pop, and the accent color aligns with the PyImageSearch visual style.
Next up, we’ll build the Lesson 2 app itself, step by step — walking through the lesson2_main.py code page by page, explaining how navigation, data handling, and visualization come together.
Building the Lesson 2 App: Overview Page
In the initial lesson, we explored how Streamlit reruns scripts top-to-bottom and automatically maintains widget state. The current lesson builds on that foundation to create a multi-section data explorer: a real, usable mini-tool that lets users navigate between pages, upload datasets, visualize trends, and export results.
We’ll go page-by-page, starting with the Overview page, which sets up navigation and gives users their first look at the dataset.
Imports and App Configuration
import streamlit as st
import pandas as pd
from pyimagesearch import (
    settings,
    load_iris_sample,
    load_uploaded_csv,
    iris_feature_scatter,
    dataframe_profile,
)

st.set_page_config(page_title="Lesson 2 - Your First App", layout="wide")

st.title("🛠️ Lesson 2: Building Your First Streamlit App")
st.write(
    "We expand with: sidebar navigation, caching, file upload, charts, and simple data profiling."
)
This block does several things:
- Imports Streamlit and pandas as usual.
- Pulls helper functions directly from the
pyimagesearchpackage — everything you reviewed in an earlier section. - Calls
st.set_page_config()before rendering anything; this locks in the page title and sets a wide layout, giving charts and tables more horizontal space. - Displays a title and a short description at the top of the app, establishing context for users.

Caching the Base Dataset
@st.cache_data(show_spinner=False)
def get_base_data() -> pd.DataFrame:
    return load_iris_sample(settings.default_sample_path)
This function wraps the Iris sample loader with @st.cache_data.
It ensures that the dataset is read from disk only once — no matter how many times you switch pages or interact with widgets.
show_spinner=False hides Streamlit’s default loading animation for an even smoother user experience.
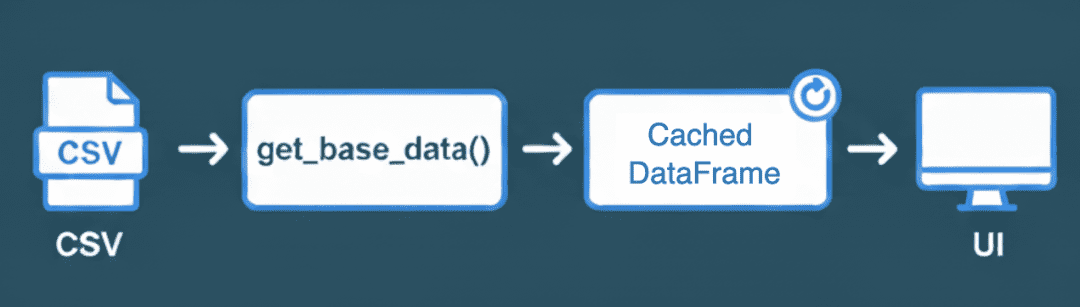
get_base_data(), converted into a cached DataFrame, and then rendered dynamically in the UI for faster and smoother app performance (source: image by the author).Sidebar Navigation
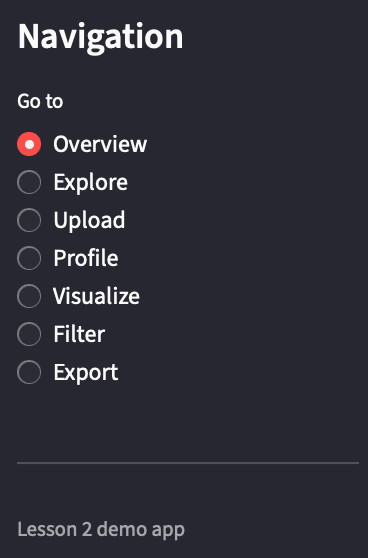
st.sidebar.title("Navigation")
page = st.sidebar.radio(
    "Go to",
    [
        "Overview",
        "Explore",
        "Upload",
        "Profile",
        "Visualize",
        "Filter",
        "Export",
    ],
)

st.sidebar.markdown("---")
st.sidebar.caption("Lesson 2 demo app")
Here, you introduce a simple single-page navigation pattern using a sidebar radio button.
Each choice sets the variable page, which you’ll use later if page == ... blocks to render the corresponding section.
This pattern feels like multiple pages but remains inside one file, perfect for small prototypes before graduating to the pages/ folder structure.
Displaying the Overview Page
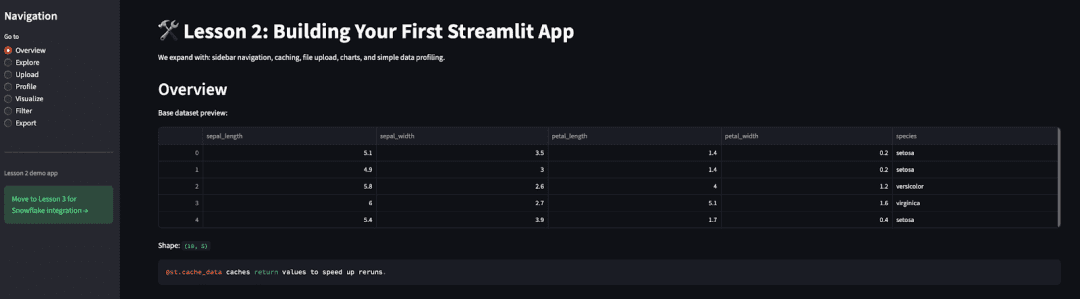
base_df = get_base_data()

if page == "Overview":
    st.header("Overview")
    st.write("Base dataset preview:")
    st.dataframe(base_df.head())
    st.write("Shape:", base_df.shape)
    st.code("""@st.cache_data caches return values to speed up reruns.""")
When "Overview" is selected:
- You call
get_base_data()once and store its result inbase_df. - You display a header, a five-row preview of the dataset, and its shape (rows × columns).
- Finally, you include a code snippet reminding users about caching, reinforcing a key concept from the initial lesson.
This page serves as both a sanity check and an orientation point before users explore deeper pages.
Why This Structure Matters
Even at this stage, 3 best practices are visible:
- Modularity: data loading is abstracted into a function, so future datasets only require swapping the path.
- State simplicity: everything shown on screen can be re-derived from the cached DataFrame.
- Declarative UI: layout is described by what you want to show, not how to render it.
This clean foundation lets you scale up to more complex sections (i.e., charts, filters, and uploads) without refactoring.
Next, we’ll expand into the Explore page, where you add the first interactive chart using Altair.
Explore Page: Interactive Scatter Plot
The Explore page is the first real “aha” moment in this lesson, where you move from static tables to live, interactive charts. This page lets users compare two numeric features of the dataset using a scatter plot generated by the reusable iris_feature_scatter() helper from visualization.py.
Code Block
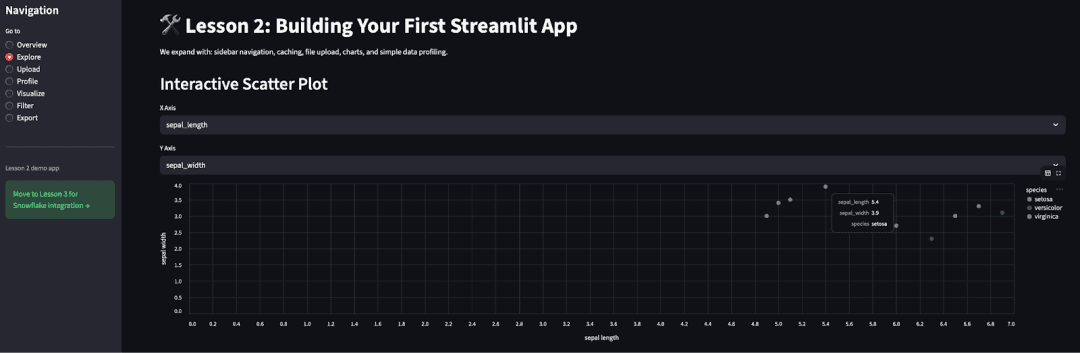
elif page == "Explore":
    st.header("Interactive Scatter Plot")
    numeric_cols = [c for c in base_df.columns if c not in {"species"}]
    x = st.selectbox("X Axis", numeric_cols, index=0)
    y = st.selectbox("Y Axis", numeric_cols, index=1)
    chart = iris_feature_scatter(base_df, x, y)
    st.altair_chart(chart, use_container_width=True)
How It Works
- Page Header
st.header("Interactive Scatter Plot")
Creates a clean visual break and labels the current page context.
- Selecting Numeric Columns
numeric_cols = [c for c in base_df.columns if c not in {"species"}]
Here, we dynamically detect all numeric columns, filtering out the categorical target column species. This ensures users only pick variables suited for plotting.
- Axis Selection Widgets
x = st.selectbox("X Axis", numeric_cols, index=0)
y = st.selectbox("Y Axis", numeric_cols, index=1)
Two dropdowns let users choose which numeric features to plot on the X and Y axes. Each time the user changes a selection, Streamlit reruns the script, instantly updating the chart.
- Rendering the Chart
chart = iris_feature_scatter(base_df, x, y)
st.altair_chart(chart, use_container_width=True)
The helper function builds the Altair chart with built-in hover tooltips and smooth interactivity.
Passing use_container_width=True ensures the chart adapts to the full column width of the page, which is critical for dashboards viewed on various screen sizes.
Why Use a Helper Here
Encapsulating the plotting logic in iris_feature_scatter() keeps your main script readable and avoids repetition.
You can later reuse the same helper for other Iris-like datasets or even parameterize it to color-code points by a user-selected categorical column (e.g., color_col).
What You Learned
- How to connect widgets to visualizations declaratively.
- How Streamlit’s rerun model instantly reflects state changes.
- Why Altair is an excellent fit for quick, interactive EDA (exploratory data analysis) interfaces.
Next, we’ll continue with the Upload page, where users can import their own CSV files and preview or profile them directly in the app.
This lesson is to be completed in Part 2.
What's next? We recommend PyImageSearch University.

86+ total classes • 115+ hours hours of on-demand code walkthrough videos • Last updated: March 2026
★★★★★ 4.84 (128 Ratings) • 16,000+ Students Enrolled
I strongly believe that if you had the right teacher you could master computer vision and deep learning.
Do you think learning computer vision and deep learning has to be time-consuming, overwhelming, and complicated? Or has to involve complex mathematics and equations? Or requires a degree in computer science?
That’s not the case.
All you need to master computer vision and deep learning is for someone to explain things to you in simple, intuitive terms. And that’s exactly what I do. My mission is to change education and how complex Artificial Intelligence topics are taught.
If you're serious about learning computer vision, your next stop should be PyImageSearch University, the most comprehensive computer vision, deep learning, and OpenCV course online today. Here you’ll learn how to successfully and confidently apply computer vision to your work, research, and projects. Join me in computer vision mastery.
Inside PyImageSearch University you'll find:
- ✓ 86+ courses on essential computer vision, deep learning, and OpenCV topics
- ✓ 86 Certificates of Completion
- ✓ 115+ hours hours of on-demand video
- ✓ Brand new courses released regularly, ensuring you can keep up with state-of-the-art techniques
- ✓ Pre-configured Jupyter Notebooks in Google Colab
- ✓ Run all code examples in your web browser — works on Windows, macOS, and Linux (no dev environment configuration required!)
- ✓ Access to centralized code repos for all 540+ tutorials on PyImageSearch
- ✓ Easy one-click downloads for code, datasets, pre-trained models, etc.
- ✓ Access on mobile, laptop, desktop, etc.
Citation Information
Singh, V. “Building Your First Streamlit App: Uploads, Charts, and Filters (Part 1),” PyImageSearch, P. Chugh, S. Huot, A. Sharma, and P. Thakur, eds., 2025, https://pyimg.co/1fzat
@incollection{Singh_2025_Building-Your-First-Streamlit-App-Part-1,
  author = {Vikram Singh},
  title = {{Building Your First Streamlit App: Uploads, Charts, and Filters (Part 1)}},
  booktitle = {PyImageSearch},
  editor = {Puneet Chugh and Susan Huot and Aditya Sharma and Piyush Thakur},
  year = {2025},
  url = {https://pyimg.co/1fzat},
}
To download the source code to this post (and be notified when future tutorials are published here on PyImageSearch), simply enter your email address in the form below!
Download the Source Code and FREE 17-page Resource Guide
Enter your email address below to get a .zip of the code and a FREE 17-page Resource Guide on Computer Vision, OpenCV, and Deep Learning. Inside you'll find my hand-picked tutorials, books, courses, and libraries to help you master CV and DL!
Comment section
Hey, Adrian Rosebrock here, author and creator of PyImageSearch. While I love hearing from readers, a couple years ago I made the tough decision to no longer offer 1:1 help over blog post comments.
At the time I was receiving 200+ emails per day and another 100+ blog post comments. I simply did not have the time to moderate and respond to them all, and the sheer volume of requests was taking a toll on me.
Instead, my goal is to do the most good for the computer vision, deep learning, and OpenCV community at large by focusing my time on authoring high-quality blog posts, tutorials, and books/courses.
If you need help learning computer vision and deep learning, I suggest you refer to my full catalog of books and courses — they have helped tens of thousands of developers, students, and researchers just like yourself learn Computer Vision, Deep Learning, and OpenCV.
Click here to browse my full catalog.