We previously learned about the k-NN classifier — a machine learning model so simple that it doesn’t do any actual “learning” at all. We simply have to store the training data inside the model, and then predictions are made at test time by comparing the testing data points to our training data.
We’ve already discussed many of the pros and cons of k-NN, but in the context of large-scale datasets and deep learning, the most prohibitive aspect of k-NN is the data itself. While training may be simple, testing is quite slow, with the bottleneck being the distance computation between vectors. Computing the distances between training and testing points scales linearly with the number of points in our dataset, making the method impractical when our datasets become quite large. And while we can apply Approximate Nearest Neighbor methods such as ANN, FLANN, or Annoy, to speed up the search, that still doesn’t alleviate the problem that k-NN cannot function without maintaining a replica of data inside the instantiation (or at least have a pointer to training set on disk, etc.).
To see why storing an exact replica of the training data inside the model is an issue, consider training a k-NN model and then deploying it to a customer base of 100, 1,000, or even 1,000,000 users. If your training set is only a few megabytes, this may not be a problem — but if your training set is measured in gigabytes to terabytes (as is the case for many datasets that we apply deep learning to), you have a real problem on your hands.
Consider the training set of the ImageNet dataset, which includes over 1.2 million images. If we trained a k-NN model on this dataset and then tried to deploy it to a set of users, we would need these users to download the k-NN model which internally represents replicas of the 1.2 million images. Depending on how you compress and store the data, this model could measure in hundreds of gigabytes to terabytes in storage costs and network overhead. Not only is this a waste of resources, but it’s also not optimal for constructing a machine learning model.
Instead, a more desirable approach would be to define a machine learning model that can learn patterns from our input data during training time (requiring us to spend more time on the training process), but have the benefit of being defined by a small number of parameters that can easily be used to represent the model, regardless of training size. This type of machine learning is called parameterized learning, which is defined as:
A learning model that summarizes data with a set of parameters of fixed size (independent of the number of training examples) is called a parametric model. No matter how much data you throw at the parametric model, it won’t change its mind about how many parameters it needs.
— Russell and Norvig (2009)
We’ll review the concept of parameterized learning and discuss how to implement a simple linear classifier. As we’ll see later, parameterized learning is the cornerstone of modern day machine learning and deep learning algorithms.
Remark: Much of this material was inspired by Andrej Karpathy’s excellent Linear Classification notes inside Stanford’s cs231n class. A big thank you to Karpathy and the rest of the cs231n teaching assistants for putting together such accessible notes.
An Introduction to Linear Classification with Python
I’ve used the word “parameterized” a few times now, but what exactly does it mean?
Simply put: parameterization is the process of defining the necessary parameters of a given model. In the task of machine learning, parameterization involves defining a problem in terms of four key components: data, a scoring function, a loss function, and weights and biases. We’ll review each of these below.
Data
This component is our input data that we are going to learn from. This data includes both the data points (i.e., raw pixel intensities from images, extracted features, etc.) and their associated class labels. Typically we denote our data in terms of a multi-dimensional design matrix.
Each row in the design matrix represents a data point while each column (which itself could be a multi-dimensional array) of the matrix corresponds to a different feature. For example, consider a dataset of 100 images in the RGB color space, each image sized 32×32 pixels. The design matrix for this dataset would be X ⊆ R100×(32×32×3), where Xi defines the i-th image in R. Using this notation, X1 is the first image, X2 the second image, and so on.
Along with the design matrix, we also define a vector y where yi provides the class label for the i-th example in the dataset.
Scoring Function
The scoring function accepts our data as an input and maps the data to class labels. For instance, given our set of input images, the scoring function takes these data points, applies some function f (our scoring function), and then returns the predicted class labels, similar to the pseudocode below:
INPUT_IMAGES => F(INPUT_IMAGES) => OUTPUT_CLASS_LABELS
Loss Function
A loss function quantifies how well our predicted class labels agree with our ground-truth labels. The higher level of agreement between these two sets of labels, the lower our loss (and higher our classification accuracy, at least on the training set).
Our goal when training a machine learning model is to minimize the loss function, thereby increasing our classification accuracy.
Weights and Biases
The weight matrix, typically denoted as W and the bias vector b are called the weights or parameters of our classifier that we’ll actually be optimizing. Based on the output of our scoring function and loss function, we’ll be tweaking and fiddling with the values of the weights and biases to increase classification accuracy.
Depending on your model type, there may exist many more parameters, but at the most basic level, these are the four building blocks of parameterized learning that you’ll commonly encounter. Once we’ve defined these four key components, we can then apply optimization methods that allow us to find a set of parameters W and b that minimize our loss function with respect to our scoring function (while increasing classification accuracy on our data).
Next, let’s look at how these components can work together to build a linear classifier, transforming the input data into actual predictions.
Linear Classification: From Images to Labels
In this section, we are going to look at a more mathematical motivation of the parameterized model approach to machine learning.
To start, we need our data. Let’s assume that our training dataset is denoted as xi where each image has an associated class label yi. We’ll assume that i = 1, …, N and yi = 1, …, K, implying that we have N data points of dimensionality D, separated into K unique categories.
To make this idea more concrete, consider an “Animals” dataset from the lesson on image classifiers. In such a dataset, we may have N = 3,000 total images. Each image is 32×32 pixels, represented in the RGB color space (i.e., three channels per image). We can represent each image as D = 32×32×3 = 3,072 distinct values. Finally, we know there are a total of K = 3 class labels: one for the dog, cat, and panda classes, respectively.
Given these variables, we must now define a scoring function f that maps the images to the class label scores. One method to accomplish this scoring is via a simple linear mapping:
(1)
Let’s assume that each xi is represented as a single column vector with shape [D×1] (in this example we would flatten the 32×32×3 image into a list of 3,072 integers). Our weight matrix W would then have a shape of [K×D] (the number of class labels by the dimensionality of the input images). Finally b, the bias vector would be of size [K×1]. The bias vector allows us to shift and translate our scoring function in one direction or another without actually influencing our weight matrix W. The bias parameter is often critical for successful learning.
Going back to the Animals dataset example, each xi is represented by a list of 3,072 pixel values, so xi, therefore, has the shape [3,072×1]. The weight matrix W will have a shape of [3×3,072] and finally the bias vector b will be of size [3×1].
Figure 1 follows an illustration of the linear classification scoring function f . On the left, we have our original input image, represented as a 32×32×3 image. We then flatten this image into a list of 3,072 pixel intensities by taking the 3D array and reshaping it into a 1D list.
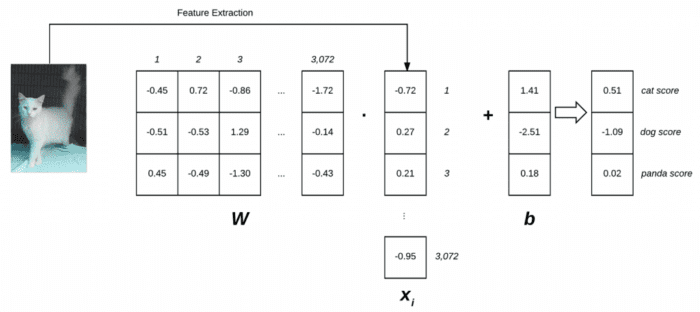
Our weight matrix W contains three rows (one for each class label) and 3,072 columns (one for each of the pixels in the image). After taking the dot product between W and xi, we add in the bias vector b — the result is our actual scoring function. Our scoring function yields three values on the right: the scores associated with the dog, cat, and panda labels, respectively.
Remark: Readers who are unfamiliar with taking dot products should read this quick and concise tutorial. For readers interested in studying linear algebra in-depth, I highly recommend working through Coding the Matrix Linear Algebra through Applications to Computer Science by Philip N. Klein (2013).
Looking at Figure 1 and Equation (1), you can convince yourself that the input xi and yi are fixed and not something we can modify. Sure, we can obtain different xis by applying various transformations to the input image — but once we pass the image into the scoring function, these values do not change. In fact, the only parameters that we have any control over (in terms of parameterized learning) are our weight matrix W and our bias vector b. Therefore, our goal is to utilize both our scoring function and loss function to optimize (i.e., modify in a systematic way) the weight and bias vectors such that our classification accuracy increases.
Exactly how we optimize the weight matrix depends on our loss function, but typically involves some form of gradient descent.
Advantages of Parameterized Learning and Linear Classification
There are two primary advantages to utilizing parameterized learning:
- Once we are done training our model, we can discard the input data and keep only the weight matrix W and the bias vector b. This substantially reduces the size of our model since we need to store two sets of vectors (versus the entire training set).
- Classifying new test data is fast. In order to perform a classification, all we need to do is take the dot product of W and xi, follow by adding in the bias b (i.e., apply our scoring function). Doing it this way is significantly faster than needing to compare each testing point to every training example, as in the k-NN algorithm.
A Simple Linear Classifier With Python
Now that we’ve reviewed the concept of parameterized learning and linear classification, let’s implement a very simple linear classifier using Python.
The purpose of this example is not to demonstrate how we train a model from start to finish. The purpose of this example is to show how we would initialize a weight matrix W, bias vector b, and then use these parameters to classify an image via a simple dot product.
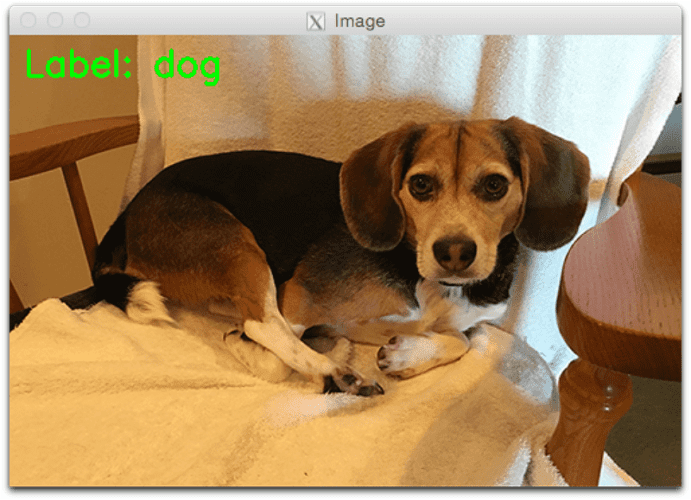
Let’s go ahead and get this example started. Our goal here is to write a Python script that will correctly classify Figure 2 as “dog.”

To see how we can accomplish this classification, open a new file, name it linear_example.py, and insert the following code:
# import the necessary packages
import numpy as np
import cv2

# initialize the class labels and set the seed of the pseudorandom
# number generator so we can reproduce our results
labels = ["dog", "cat", "panda"]
np.random.seed(1)
Lines 2 and 3 import our required Python packages. We’ll use NumPy for our numerical processing and OpenCV to load our example image from disk.
Line 7 initializes the list of target class labels for the “Animals” dataset while Line 8 sets the pseudorandom number generator for NumPy, ensuring that we can reproduce the results of this experiment.
Next, let’s initialize our weight matrix and bias vector:
# randomly initialize our weight matrix and bias vector -- in a
# *real* training and classification task, these parameters would
# be *learned* by our model, but for the sake of this example,
# let's use random values
W = np.random.randn(3, 3072)
b = np.random.randn(3)
Line 14 initializes the weight matrix W with random values from a normal distribution, with zero mean and unit variance. Weights inside of a neural network are able to take on negative, positive, and zero values. This weight matrix has 3 rows (one for each of the class labels) and 3072 columns (one for each of the pixels in our 32×32×3 image).
We then initialize the bias vector on Line 15 — this vector is also randomly filled with values sampled over a standard normal distribution. Our bias vector has 3 rows (corresponding to the number of class labels) along with one column.
If we were training this linear classifier from scratch we would need to learn the values of W and b through an optimization process. However, since we have not reached the optimization stage of training a model, I have initialized the pseudorandom number generator with a value 1 to ensure the random values give us the “correct” classification (I tested random initialization values ahead of time to determine which value gives us the correct classification). For the time being, simply treat the weight matrix W and the bias vector b as “black box arrays” that are optimized in a magical way — we’ll pull back the curtain and reveal how these parameters are learned in future lessons.
Now that our weight matrix and bias vector are initialized, let’s load our example image from disk:
# load our example image, resize it, and then flatten it into our
# "feature vector" representation
orig = cv2.imread("beagle.png")
image = cv2.resize(orig, (32, 32)).flatten()
Line 19 loads our image from disk via cv2.imread. We then resize the image to 32×32 pixels (ignoring the aspect ratio) on Line 20 — our image is now represented as a (32, 32, 3) NumPy array, which we flatten into a 3,072-dim vector.
The next step is to compute the output class label scores by applying our scoring function:
# compute the output scores by taking the dot product between the
# weight matrix and image pixels, followed by adding in the bias
scores = W.dot(image) + b
Line 24 is the scoring function itself — it’s simply the dot product between the weight matrix W and the input image pixel intensities, followed by adding in the bias b.
Finally, our last code block handles writing the scoring function values for each of the class labels to our terminal, then displaying the result to our screen:
# loop over the scores + labels and display them
for (label, score) in zip(labels, scores):
	print("[INFO] {}: {:.2f}".format(label, score))

# draw the label with the highest score on the image as our
# prediction
cv2.putText(orig, "Label: {}".format(labels[np.argmax(scores)]),
	(10, 30), cv2.FONT_HERSHEY_SIMPLEX, 0.9, (0, 255, 0), 2)

# display our input image
cv2.imshow("Image", orig)
cv2.waitKey(0)
To execute our example, just issue the following command:
$ python linear_example.py
[INFO] dog: 7963.93
[INFO] cat: -2930.99
[INFO] panda: 3362.47
Notice how the dog class has the largest scoring function value, which implies that the “dog” class would be chosen as the prediction by our classifier. In fact, we can see the text dog correctly drawn on our input image (Figure 2) in Figure 3.
Again, keep in mind that this was a worked example. I purposely set the random state of our Python script to generate W and b values that would lead to the correct classification (you can change the pseudorandom seed value on Line 8 to see for yourself how different random initializations will produce different output predictions).
In practice, you would never initialize your W and b values and assume they would give you the correct classification without some sort of learning process. Instead, when training our own machine learning models from scratch we would need to optimize and learn W and b via an optimization algorithm, such as gradient descent.
We’ll cover optimization and gradient descent in a future lesson, but in the meantime, take the time to ensure you understand Line 24 and how a linear classifier makes a classification by taking the dot product between a weight matrix and an input data point, followed by adding in the bias. Our entire model can therefore be defined via two values: the weight matrix and the bias vector. This representation is not only compact but also quite powerful when we train machine learning models from scratch.
The Role of Loss Functions
In our last section we discussed the concept of parameterized learning. This type of learning allows us to take sets of input data and class labels, and actually learn a function that maps the input to the output predictions by defining a set of parameters and optimizing over them.
But in order to actually “learn” the mapping from the input data to class labels via our scoring function, we need to discuss two important concepts:
- Loss functions
- Optimization methods
Let’s explore common loss functions you’ll encounter when building neural networks and deep learning networks.
Our exploration is a brief review of loss functions and their role in parameterized learning. If you wish to complement this lesson with more mathematically rigorous derivations, I would highly recommend Andrew Ng’s Coursera course, Witten et al. (2011), Harrington (2012), and Marsland (2009).
What Are Loss Functions?
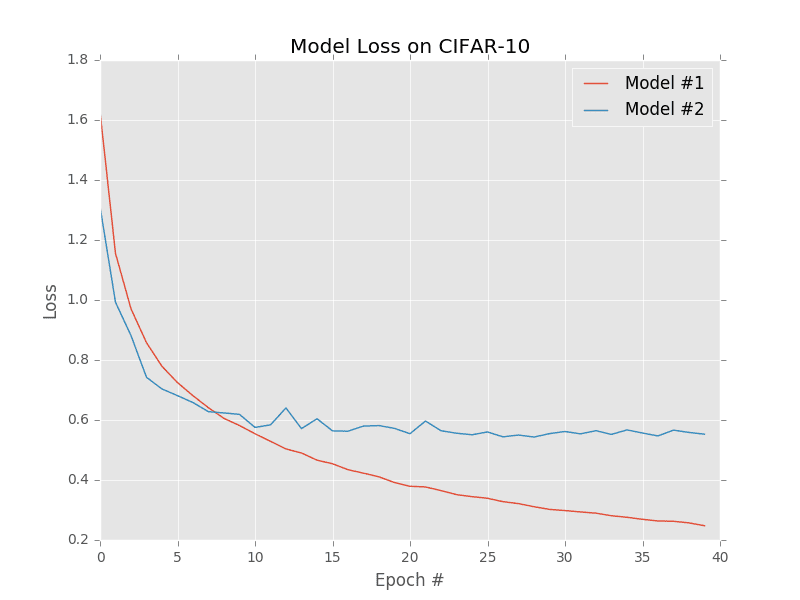
At the most basic level, a loss function quantifies how “good” or “bad” a given predictor is at classifying the input data points in a dataset. A visualization of loss functions plotted over time for two separate models trained on the CIFAR-10 dataset is shown in Figure 4. The smaller the loss, the better a job the classifier is at modeling the relationship between the input data and output class labels (although there is a point where we can overfit our model — by modeling the training data too closely, our model loses the ability to generalize. Conversely, the larger our loss, the more work needs to be done to increase classification accuracy.
To improve our classification accuracy, we need to tune the parameters of our weight matrix W or bias vector b. Exactly how we go about updating these parameters is an optimization problem, which we’ll be covering in a future lesson. For the time being, simply understand that a loss function can be used to quantify how well our scoring function is doing at classifying input data points.
Ideally, our loss should decrease over time as we tune our model parameters. As Figure 4 demonstrates, Model #1’s loss starts slightly higher than Model #2, but then decreases rapidly and continues to stay low when trained on the CIFAR-10 dataset. Conversely, the loss for Model #2 decreases initially but quickly stagnates. In this specific example, Model #1 is achieving lower overall loss and is likely a more desirable model to be used on classifying other images from the CIFAR-10 dataset. I say “likely” because there is a chance that Model #1 has overfit to the training data. We’ll cover this concept of overfitting and how to spot it in a future lesson.
Multi-class SVM Loss
Multi-class SVM Loss (as the name suggests) is inspired by (Linear) Support Vector Machines (SVMs), which uses a scoring function f to map our data points to numerical scores for each class labels. This function f is a simple learning mapping:
(2)
Now that we have our scoring function, we need to determine how “good” or “bad” this function is (given the weight matrix W and bias vector b) at making predictions. To make this determination, we need a loss function.
Recall that when creating a machine learning model we have a design matrix X, where each row in X contains a data point we wish to classify. In the context of image classification, each row in X is an image and we seek to correctly label this image. We can access the i-th image inside X via the syntax xi.
Similarly, we also have a vector y, which contains our class labels for each X. These y values are our ground-truth labels and what we hope our scoring function will correctly predict. Just like we can access a given image as xi, we can access the associated class label via yi.
As a matter of simplicity, let’s abbreviate our scoring function as s:
(3)
which implies that we can obtain the predicted score of the j-th class via the i-th data point:
(4)
Using this syntax, we can put it all together, obtaining the hinge loss function:
(5)
Remark: Nearly all loss functions include a regularization term. I am skipping this idea for now as we’ll review regularization in a future lesson when we understand loss functions better.
Looking at the hinge loss equation above, you might be confused at what it’s actually doing. Essentially, the hinge loss function is summing across all incorrect classes (i ≠ j) and comparing the output of our scoring function s returned for the j-th class label (the incorrect class) and the yi-th class (the correct class). We apply the max operation to clamp values at zero, which is important to ensure we do not sum negative values.
A given xi is classified correctly when the loss Li = 0 (I’ll provide a numerical example in the following section). To derive the loss across our entire training set, we simply take the mean over each individual Li:
(6)
Another related loss function you may encounter is the squared hinge loss:
(7)
The squared term penalizes our loss more heavily by squaring the output, which leads to quadratic growth in loss in a prediction that is incorrect (versus a linear growth).
As for which loss function you should use, that is entirely dependent on your dataset. It’s typical to see the standard hinge loss function used more, but on some datasets the squared variation may obtain better accuracy. Overall, this is a hyperparameter that you should consider tuning.
A Multi-class SVM Loss Example
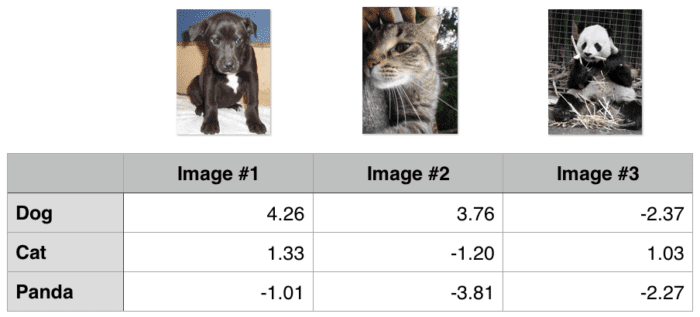
Now that we’ve taken a look at the mathematics behind hinge loss, let’s examine a worked example. We’ll again be using the “Animals” dataset which aims to classify a given image as containing a cat, dog, or panda. To start, take a look at Figure 5, where I have included three training examples from the three classes of the “Animals” dataset.

Given some arbitrary weight matrix W and bias vector b, the output scores of f(x,W) = W x+b are displayed in the body of the matrix. The larger the scores are, the more confident our scoring function is regarding the prediction.
Let’s start by computing the loss Li for the “dog” class:
>>> max(0, 1.33 - 4.26 + 1) + max(0, -1.01 - 4.26 + 1)
0
Notice how our equation here includes two terms — the difference between the predicted dog score and both the cat and panda score. Also, observe how the loss for “dog” is zero — this implies that the dog was correctly predicted. A quick investigation of Image #1 from Figure 5 demonstrates this result to be true: the “dog” score is greater than both the “cat” and “panda” scores.
Similarly, we can compute the hinge loss for Image #2, this one containing a cat:
>>> max(0, 3.76 - (-1.20) + 1) + max(0, -3.81 - (-1.20) + 1)
5.96
In this case, our loss function is greater than zero, indicating that our prediction is incorrect. Looking at our scoring function, we see that our model predicts dog as the proposed label with a score of 3.76 (as this is the label with the highest score). We know that this label is incorrect — and in a future lesson, we’ll learn how to automatically tune our weights to correct these predictions.
Finally, let’s compute the hinge loss for the panda example:
>>> max(0, -2.37 - (-2.27) + 1) + max(0, 1.03 - (-2.27) + 1)
5.199999999999999
Again, our loss is non-zero, so we know we have an incorrect prediction. Looking at our scoring function, our model has incorrectly labeled this image as “cat” when it should be “panda.”
We can then obtain the total loss over the three examples by taking the average:
>>> (0.0 + 5.96 + 5.2) / 3.0
3.72
Therefore, given our three training examples our overall hinge loss is 3.72 for the parameters W and b.
Also take note that our loss was zero for only one of the three input images, implying that two of our predictions were incorrect. In a future lesson, we’ll learn how to optimize W and b to make better predictions by using the loss function to help drive and steer us in the right direction.
Cross-entropy Loss and Softmax Classifiers
While hinge loss is quite popular, you’re much more likely to run into cross-entropy loss and Softmax classifiers in the context of deep learning and convolutional neural networks.
Why is this? Simply put:
Softmax classifiers give you probabilities for each class label while hinge loss gives you the margin.
It’s much easier for us as humans to interpret probabilities rather than margin scores. Furthermore, for datasets such as ImageNet, we often look at the rank-5 accuracy of Convolutional Neural Networks (where we check to see if the ground-truth label is in the top-5 predicted labels returned by a network for a given input image). Seeing if (1) the true class label exists in the top-5 predictions and (2) the probability associated with each label is a nice property.
Understanding Cross-entropy Loss
The Softmax classifier is a generalization of the binary form of Logistic Regression. Just like in hinge loss or squared hinge loss, our mapping function f is defined such that it takes an input set of data xi and maps them to output class labels via dot product of the data xi and weight matrix W (omitting the bias term for brevity):
(8)
However, unlike hinge loss, we can interpret these scores as unnormalized log probabilities for each class label, which amounts to swapping out the hinge loss function with cross-entropy loss:
(9)
So, how did I arrive here? Let’s break the function apart and take a look. To start, our loss function should minimize the negative log likelihood of the correct class:
(10)
The probability statement can be interpreted as:
(11)
where we use our standard scoring function form:
(12)
As a whole, this yields our final loss function for a single data point, just like above:
(13)
Take note that your logarithm here is actually base e (natural logarithm) since we are taking the inverse of the exponentiation over e earlier. The actual exponentiation and normalization via the sum of exponents is our Softmax function. The negative log yields our actual cross-entropy loss.
Just as in hinge loss and squared hinge loss, computing the cross-entropy loss over an entire dataset is done by taking the average:
(14)
Again, I’m purposely omitting the regularization term from our loss function. We’ll return to regularization, explain what it is, how to use it, and why it’s critical to neural networks and deep learning in a future lesson. If the equations above seem scary, don’t worry — we’re about to work through numerical examples in the next section to ensure you understand how cross-entropy loss works.
A Worked Softmax Example
To demonstrate cross-entropy loss in action, consider Figure 6. Our goal is to classify whether the image above contains a dog, cat, or panda. Clearly, we can see that the image is a “panda” — but what does our Softmax classifier think? To find out, we’ll need to work through each of the four tables in the figure.
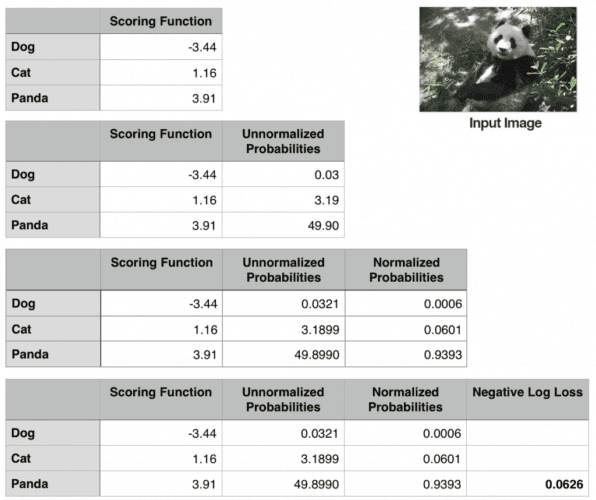
The first table includes the output of our scoring function f for each of the three classes, respectively. These values are our unnormalized log probabilities for the three classes. Let’s exponentiate the output of the scoring function (es, where s is our score function value), yielding our unnormalized probabilities (second table).
The next step is to take the denominator of Equation (11), sum the exponents, and divide by the sum, thereby yielding the actual probabilities associated with each class label (third table). Notice how the probabilities sum to one.
Finally, we can take the negative natural logarithm, −ln(p), where p is the normalized probability, yielding our final loss (the fourth and final table).
In this case, our Softmax classifier would correctly report the image as panda with 93.93% confidence. We can then repeat this process for all images in our training set, take the average, and obtain the overall cross-entropy loss for the training set. This process allows us to quantify how good or bad a set of parameters are performing on our training set.
Remark: I used a random number generator to obtain the score function values for this particular example. These values are simply used to demonstrate how the calculations of the Softmax classifier/cross-entropy loss function are performed. In reality, these values would not be randomly generated — they would instead be the output of your scoring function f based on your parameters W and b.
What's next? We recommend PyImageSearch University.
86+ total classes • 115+ hours hours of on-demand code walkthrough videos • Last updated: February 2026
★★★★★ 4.84 (128 Ratings) • 16,000+ Students Enrolled
I strongly believe that if you had the right teacher you could master computer vision and deep learning.
Do you think learning computer vision and deep learning has to be time-consuming, overwhelming, and complicated? Or has to involve complex mathematics and equations? Or requires a degree in computer science?
That’s not the case.
All you need to master computer vision and deep learning is for someone to explain things to you in simple, intuitive terms. And that’s exactly what I do. My mission is to change education and how complex Artificial Intelligence topics are taught.
If you're serious about learning computer vision, your next stop should be PyImageSearch University, the most comprehensive computer vision, deep learning, and OpenCV course online today. Here you’ll learn how to successfully and confidently apply computer vision to your work, research, and projects. Join me in computer vision mastery.
Inside PyImageSearch University you'll find:
- ✓ 86+ courses on essential computer vision, deep learning, and OpenCV topics
- ✓ 86 Certificates of Completion
- ✓ 115+ hours hours of on-demand video
- ✓ Brand new courses released regularly, ensuring you can keep up with state-of-the-art techniques
- ✓ Pre-configured Jupyter Notebooks in Google Colab
- ✓ Run all code examples in your web browser — works on Windows, macOS, and Linux (no dev environment configuration required!)
- ✓ Access to centralized code repos for all 540+ tutorials on PyImageSearch
- ✓ Easy one-click downloads for code, datasets, pre-trained models, etc.
- ✓ Access on mobile, laptop, desktop, etc.
Summary
In this lesson, we reviewed four components of parameterized learning:
- Data
- Scoring function
- Loss function
- Weights and biases
In the context of image classification, our input data is our dataset of images. The scoring function produces predictions for a given input image. The loss function then quantifies how good or bad a set of predictions are over the dataset. Finally, the weight matrix and bias vectors are what enable us to actually “learn” from the input data — these parameters will be tweaked and tuned via optimization methods in an attempt to obtain higher classification accuracy.
We then reviewed two popular loss functions: hinge loss and cross-entropy loss. While hinge loss is used in many machine learning applications (e.g., SVMs), I can almost guarantee with absolute certainty that you’ll see cross-entropy loss with more frequency primarily due to the fact that Softmax classifiers output probabilities rather than margins. Probabilities are much easier for us as humans to interpret, so this fact is a particularly nice quality of cross-entropy loss and Softmax classifiers. For more information on hinge loss and cross-entropy loss, please refer to Stanford University’s CS231n course (http://cs231n.stanford.edu, https://cs231n.github.io/linear-classify).
In a future lesson, we’ll review optimization methods that are used to tune our weight matrix and bias vector. Optimization methods allow our algorithms to actually learn from our input data by updating the weight matrix and bias vector based on the output of our scoring and loss functions. Using these techniques we can take incremental steps towards parameter values that obtain lower loss and higher accuracy. Optimization methods are the cornerstone of modern day neural networks and deep learning, and without them, we would be unable to learn patterns from our input data.

Download the Source Code and FREE 17-page Resource Guide
Enter your email address below to get a .zip of the code and a FREE 17-page Resource Guide on Computer Vision, OpenCV, and Deep Learning. Inside you'll find my hand-picked tutorials, books, courses, and libraries to help you master CV and DL!


Great tutorial and explanation,thank you! I want to use feature extractors like Sift,Surf or Hog instead of Color_histogram,can you show me how?thank you
I demonstrate how to use Histogram of Oriented Gradients as feature inputs to a Linear SVM inside Practical Python and OpenCV. To utilize SIFT/SURF or other keypoint detectors + local invariant descriptors you’ll need to construct a bag of visual words (BOVW) model. I discuss the BOVW model in detail (with lots of code examples) and apply it to image classification inside PyImageSearch Gurus. Be sure to take a look!
First of all, being bored at work does pay well if you have a Smartphone and you browse through blogs.Amazing information with facts thoughtfully incorporated within. Definitely going to come back for more! 🙂
Thank you for the kind words Rohan! 🙂
Now that I have train the model how do I test it
I mean with a different image from the ones i used and it isnt labeled like the ones in the data set
You would load your image from disk, pre-process it exactly like we did in this blog post, and call
model.predicton it.For what it’s worth, I demonstrate the basics of using machine learning classifiers with OpenCV + Python inside my book, Practical Python and OpenCV.
Dear Adrian!
First I would like to thanks for your tutorial. Wonderful job and very useful source of information for newbies like me.
I want to use this classifier as a tool to extract background – water, from the images. I have to classes: water and others. Could you recommend me an approach/functions which could be the best? My idea is to based on the output I would like to give water black values, then remove unwanted objects from the image and find centroids of object of interest. The last part will be based on connecting components. Though I find it hard to mask the water. Thank you
Instead of directly using machine learning methods to create pixel-wise segmentations of the image, have you considered using other segmentation methods such as thresholding, adaptive thresholding, GrabCut, etc.?
Tbh I thought about it and already did it combining approaches with different color spaces. I have to do something with machine learning as it is my let say boss idea and I can’t do much about it
Hi Adrian. Thanks for the tutorial. It is a really big help for a newbie like me. I have a question could you recommend how, based on classification results, I can change pixel values of my two classes, to black for one and while to second class? Thanks
Hi Anna Maria — I’m not sure what you mean by “based on classification results, I can change pixel values of my classes”? What exactly are you trying to accomplish?
Hi Adrian. I wanted to use svm to perform classification over images with water and mixed(water and objects) and then change values of water into black and others into white. Extract background using svm
This sounds like a pixel-wise segmentation problem. Without seeing example images of what you’re working with, it’s hard for me to provide suggestions. You might want to consider researching pixel-wise segmentation using Random Forests. Deep learning can also be used here, but it’s likely overkill.
hello I have 1200 images that I need to cluster them based on their background color, could you tell me what algorithm would you recommend?
You could try extracting a color histogram and then applying the k-means algorithm.