Table of Contents
- Build a Real-Time Video Analytics Pipeline with YOLO26 and ByteTrack
- What Is Real-Time Video Analytics?
- Why Detection Alone Is Not Enough for People Counting and Vehicle Counting
- System Architecture for Real-Time Video Analytics
- Configuring Your Development Environment
- Project Structure
- Preparing Video Input for YOLO26 Object Detection and Tracking
- Running YOLO26 Object Detection on Video
- Adding ByteTrack Multi-Object Tracking
- Building the Analytics Layer for People Counting and Vehicle Counting
- OpenCV Visualization and Dashboard Overlay
- Video I/O: The VideoStream and VideoWriter Classes
- Performance Optimization for Real-Time Object Detection
- Running the Real-Time Video Analytics Pipeline
- Real-World Applications of People Counting and Vehicle Counting Systems
- What Can Go Wrong in Your Real-Time Video Analytics Pipeline
- Summary
Build a Real-Time Video Analytics Pipeline with YOLO26 and ByteTrack
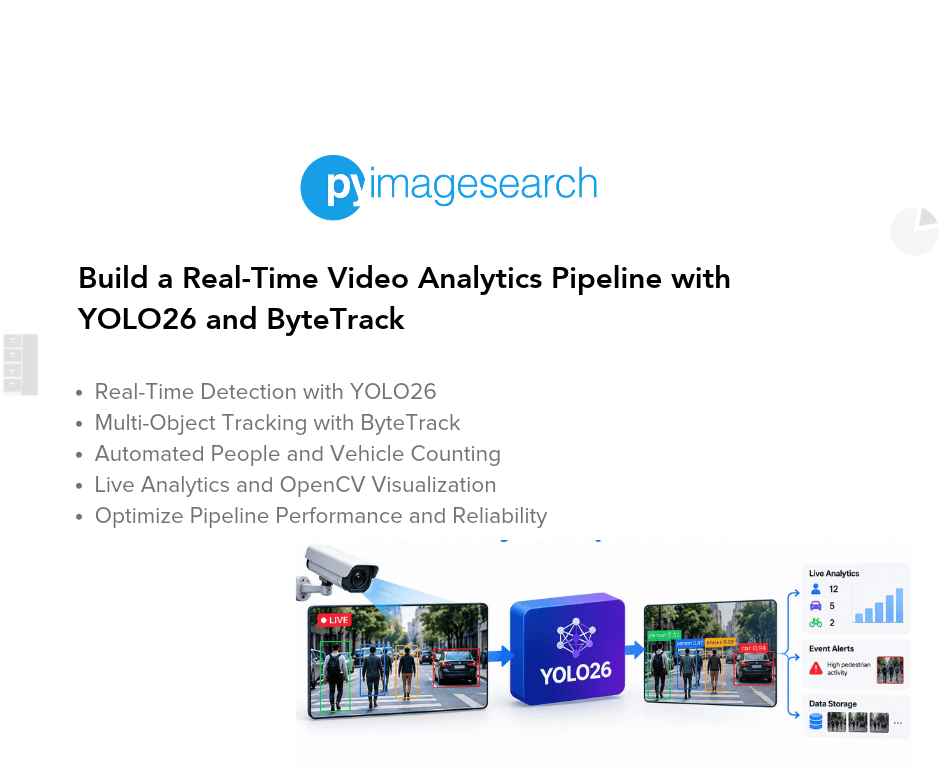
In this lesson, you will learn how to build a complete real-time video analytics pipeline using YOLO26 for object detection and ByteTrack for multi-object tracking (MOT), including line-crossing analytics for people counting and vehicle counting on macOS.
This lesson is the last in a 2-part series on YOLO26:
- YOLO26 Object Detection Tutorial: Benchmarking on macOS
- Build a Real-Time Video Analytics Pipeline with YOLO26 and ByteTrack (this tutorial)
To learn how to build a real-time video analytics pipeline with YOLO26 and ByteTrack, just keep reading.

What Is Real-Time Video Analytics?
There is a big difference between a detector and a video analytics system.
A detector answers the question, “What is in this frame right now?”
A real-time video analytics system answers questions such as:
- How many objects crossed this line?
- Which object is which across time?
- Are counts going up or down?
- Is the pipeline fast enough to run continuously?
That is the shift in this lesson. You are building a system, not just calling a model.
Why Detection Alone Is Not Enough for People Counting and Vehicle Counting
Detection by itself is frame-local. Every frame is treated independently. That becomes a problem as soon as you want to build a people counting system, a vehicle counting system, or any kind of directional event tracker.
Suppose a person appears in 40 consecutive frames. A detector will happily report that person 40 times. But your application probably does not want 40 answers. It wants one tracked entity that persists across time.
That is why you need a tracker.
The tracker takes per-frame detections and turns them into stable identities. Once stable identities exist, the analytics layer can reason over time. In your case, that means checking whether a tracked object moved from one side of a virtual line to the other.
The key idea is simple.
- Detection tells you what exists in a frame.
- Tracking tells you what persists across frames.
- Analytics tells you what events happened over time.
System Architecture for Real-Time Video Analytics
At a high level, the pipeline looks like this:
Video -> YOLO26 -> ByteTrack -> Analytics -> Output
That single line is the architecture diagram description for this lesson.
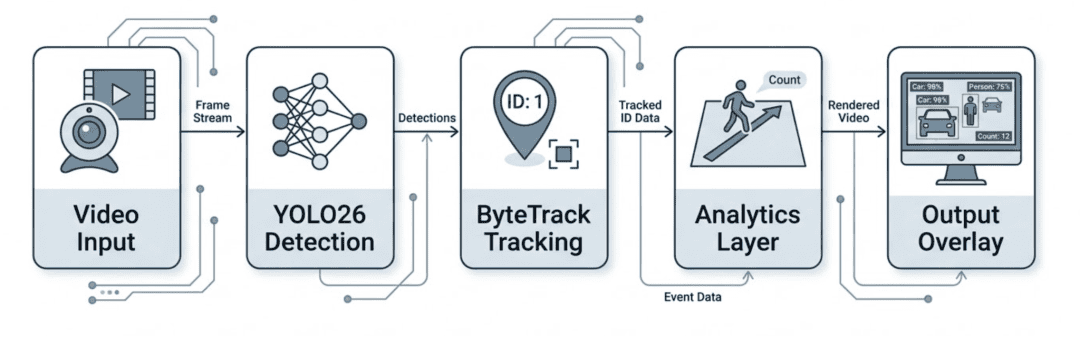
Each stage has a clear job:
Video Input
Reads frames from a webcam or video file. This layer also handles resizing and optional frame skipping.
By isolating video input/output (I/O) in its own module, you can swap between a live webcam feed and a recorded clip without touching any detection or tracking code.
YOLO26 Object Detection
Runs YOLO26 inference on the current frame and returns object detections.
The detector wraps the Ultralytics model behind a clean interface so the rest of the pipeline never interacts with the You Only Look Once (YOLO) application programming interface (API) directly. This makes it straightforward to swap in a different model later.
ByteTrack Multi-Object Tracking
Uses the ByteTrack algorithm to associate detections across frames and assign stable track identifiers (IDs).
Without this step, every frame would contain anonymous bounding boxes with no way to tell whether 2 boxes in consecutive frames belong to the same physical object.
Analytics Layer
Checks whether any tracked object crossed the configured virtual line. It also supports optional zone-based occupancy counting. The analytics layer consumes tracks (not raw detections), which is why stable IDs from ByteTrack are essential.
Output Layer
Draws boxes, IDs, counts, and frames per second (FPS) on the frame, then displays or saves it.
This overlay provides a live operator view so you can visually verify that detection, tracking, and counting are all working correctly during a run.
Configuring Your Development Environment
To follow this guide, you need to have the Ultralytics, supervision, and OpenCV libraries installed on your system.
Luckily, they are all pip-installable:
$ pip install ultralytics supervision opencv-python
If you need help configuring your development environment for this video analytics pipeline, we highly recommend creating a fresh virtual environment first.
Need Help Configuring Your Development Environment?

All that said, are you:
- Short on time?
- Learning on your employer’s administratively locked system?
- Wanting to skip the hassle of fighting with the command line, package managers, and virtual environments?
- Ready to run the code immediately on your Windows, macOS, or Linux system?
Then join PyImageSearch University today!
Gain access to Jupyter Notebooks for this tutorial and other PyImageSearch guides pre-configured to run on Google Colab’s ecosystem right in your web browser! No installation required.
And best of all, these Jupyter Notebooks will run on Windows, macOS, and Linux!
Project Structure
Let us review the project directory structure for our real-time video analytics pipeline.
Start by accessing this lesson’s “Downloads” section to retrieve the source code.
From there, take a look at the directory structure:
yolo26_video_analytics/
├── assets/
│   ├── models/
│   │   └── yolo26n.pt
│   └── videos/
│       └── traffic.mp4
├── main.py
├── requirements.txt
├── README.md
└── video_analytics/
    ├── __init__.py
    ├── __main__.py
    ├── cli.py
    ├── config.py
    ├── pipeline.py
    ├── analytics/
    │   └── engine.py
    ├── common/
    │   └── utils.py
    ├── io/
    │   └── video.py
    ├── models/
    │   ├── detector.py
    │   └── tracker.py
    └── rendering/
        └── visualization.py
This structure is intentional.
You do not want all the logic dumped into a single script. That approach collapses quickly once you add ByteTrack multi-object tracking, analytics, performance tuning, and configurable runtime behavior.
Here is what each module does:
video_analytics/config.py
Defines the pipeline configuration objects: detection settings, tracking settings, video settings, and analytics settings.
video_analytics/models/detector.py
Wraps the Ultralytics YOLO26 model and converts its raw predictions into a simple detection format for the rest of the pipeline.
video_analytics/models/tracker.py
Wraps ByteTrack so the rest of the system does not care about the underlying tracker API.
video_analytics/analytics/engine.py
Implements line-crossing logic and maintains counts over time.
video_analytics/io/video.py
Handles webcam and video input, resizing, and writing output video if requested.
video_analytics/rendering/visualization.py
Draws the operator-facing overlay: boxes, IDs, line, counts, and FPS.
video_analytics/common/utils.py
Contains small shared data structures and utility helpers.
video_analytics/cli.py and video_analytics/pipeline.py
Build the runtime configuration, assemble the pipeline, and run the real-time frame loop.
main.py
Provides a thin root-level wrapper so the application can still be launched with a simple python main.py command.
Preparing Video Input for YOLO26 Object Detection and Tracking
For this lesson, you can use any traffic or pedestrian video. The pipeline is designed to work with standard Common Objects in Context (COCO) classes (e.g., person, car, bus, and truck).
If you do not already have a video, here are some easy options:
- record a short clip with your phone
- use a public traffic or street video
- download a sample video from a public benchmark or a YouTube clip that clearly shows moving objects
For best results:
- use a clip lasting 20 to 40 seconds
- ensure objects actually cross the counting line
- avoid scenes that are either extremely crowded or almost empty
For the examples in this lesson, a traffic video where vehicles move horizontally across the frame is the easiest choice because line-crossing events are easy to see and validate.
Running YOLO26 Object Detection on Video
You already ran YOLO26 on static images in Lesson 1. Now you need a detector wrapper that is built for a video loop.
The goal here is not theoretical elegance. The goal is a clean interface.
Before looking at the detector wrapper, let us define the shared data structures that the entire pipeline uses. In video_analytics/common/utils.py, you will define Detection and Track as simple dataclasses:
from __future__ import annotations

from dataclasses import dataclass
from typing import Tuple


Point = Tuple[int, int]


@dataclass(slots=True)
class Detection:
    xyxy: Tuple[float, float, float, float]
    confidence: float
    class_id: int
    class_name: str


@dataclass(slots=True)
class Track:
    track_id: int
    xyxy: Tuple[float, float, float, float]
    confidence: float
    class_id: int
    class_name: str

    @property
    def centroid(self) -> Point:
        x1, y1, x2, y2 = self.xyxy
        return int((x1 + x2) / 2.0), int((y1 + y2) / 2.0)
Detection carries the per-frame detections from the model. Track contains the same detection fields plus a track_id and a computed centroid property that the analytics layer uses for line-crossing tests.
In video_analytics/models/detector.py, you will create a small wrapper around Ultralytics YOLO:
from typing import List

from ultralytics import YOLO

from ..common import Detection
from ..config import DetectionConfig


class YOLO26Detector:
    def __init__(self, config: DetectionConfig) -> None:
        self.config = config
        self.model = YOLO(config.model_path)

    def detect(self, frame) -> List[Detection]:
        result = self.model.predict(
            source=frame,
            conf=self.config.confidence,
            imgsz=self.config.image_size,
            device=self.config.device,
            verbose=False,
        )[0]

        boxes = result.boxes
        if boxes is None or len(boxes) == 0:
            return []
This wrapper does 3 useful things for you:
- Centralizes model configuration
- Hides the raw Ultralytics result object from the rest of the pipeline
- Converts detections into a consistent internal structure
That last part matters. When the detector returns simple Detection objects, the tracker and analytics modules stay clean.
In the same file, we extract bounding boxes, confidences, class IDs, and class names, then normalize them into our internal Detection dataclass:
xyxy = boxes.xyxy.cpu().numpy()
confidences = boxes.conf.cpu().numpy()
class_ids = boxes.cls.cpu().numpy().astype(int)
names = result.names

detections: List[Detection] = []
for box, confidence, class_id in zip(xyxy, confidences, class_ids):
    detections.append(
        Detection(
            xyxy=(float(box[0]), float(box[1]), float(box[2]), float(box[3])),
            confidence=float(confidence),
            class_id=int(class_id),
            class_name=str(names[int(class_id)]),
        )
    )
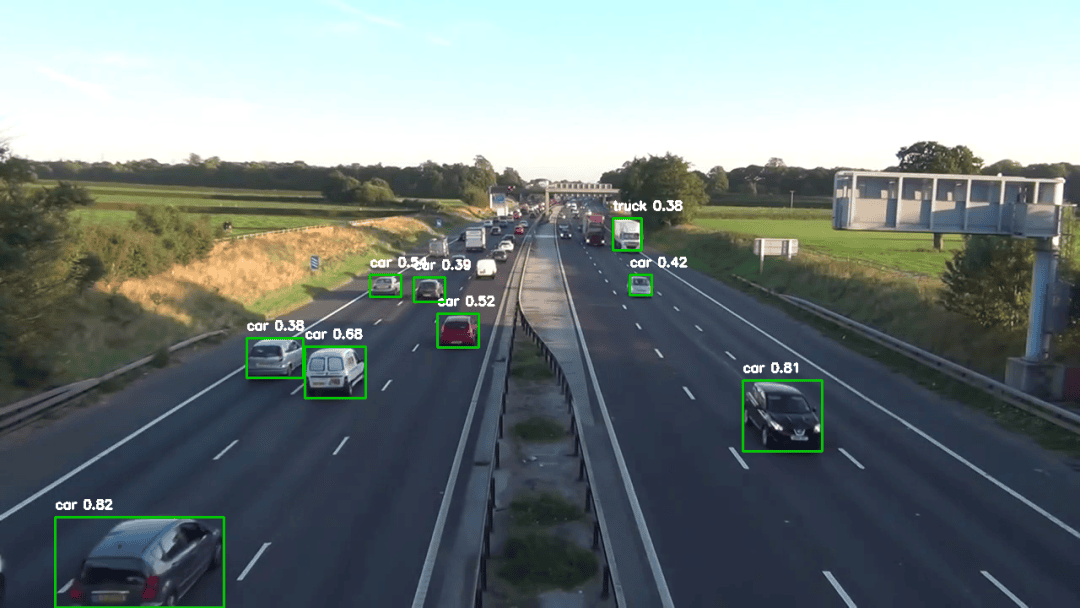
At this point, the detector stage is done. For each frame, we now have a list of objects that YOLO26 thinks are present.
Adding ByteTrack Multi-Object Tracking
Detection alone is not enough for analytics, so the next step is adding the ByteTrack algorithm.
We are using ByteTrack here because it is a strong practical fit for real-time video analytics pipelines. It is widely used, works well in detection-based MOT pipelines, and provides stable IDs without turning the lesson into a tracking theory lecture.
We are also using ByteTrack instead of a simpler centroid tracker for a reason:
- it handles occlusion and brief disappearances better than naive centroid matching
- it uses detection confidence during association
- it maintains a lost-track buffer that helps in busy scenes
That makes the ByteTrack multi-object tracking approach a much better fit for real-world people counting and vehicle counting pipelines where IDs need to stay stable under noise and partial visibility.
In video_analytics/models/tracker.py, you will wrap ByteTrack as follows:
from typing import Iterable, List

import numpy as np
import supervision as sv

from ..common import Detection, Track
from ..config import TrackingConfig


class ByteTrackTracker:
    def __init__(self, config: TrackingConfig, frame_rate: float) -> None:
        self.tracker = sv.ByteTrack(
            track_activation_threshold=config.activation_threshold,
            lost_track_buffer=config.lost_track_buffer,
            minimum_matching_threshold=config.minimum_matching_threshold,
            frame_rate=max(int(frame_rate), 1),
        )

    def update(self, detections: Iterable[Detection]) -> List[Track]:
        detections = list(detections)
        if not detections:
            empty = sv.Detections.empty()
            self.tracker.update_with_detections(empty)
            return []
The nice thing about wrapping it this way is that video_analytics/pipeline.py does not need to know anything about supervision.Detections or tracker internals.
Inside update, you convert the detection list into a tracker-friendly format:
sv_detections = sv.Detections(
    xyxy=xyxy,
    confidence=confidence,
    class_id=class_id,
    data={"class_name": metadata},
)
tracked = self.tracker.update_with_detections(sv_detections)
Then you convert the tracker output into Track objects that carry:
- track ID
- bounding box
- confidence
- class ID
- class name
That gives us exactly what the analytics layer needs.
One small but important detail is the empty-detection path above. When YOLO26 misses everything in a frame, you still forward an empty Detections object into ByteTrack so tracks age naturally instead of collapsing immediately.
Real-World Challenge: Tracker Imperfections
Tracking is not perfect.
In real-world scenes:
- objects may be temporarily lost
- track IDs may switch
- occlusions can break continuity
That matters because analytics depends on track identity. If a person disappears for a few frames and returns with a new ID, the pipeline may count them twice.
In production systems, common mitigation strategies include:
- minimum track length thresholds
- track smoothing
- time-based filtering
- re-identification models for harder scenes
This lesson keeps the implementation lightweight, but it is important to understand that tracking quality directly affects analytics quality in any people counting software or vehicle counting system.
Building the Analytics Layer for People Counting and Vehicle Counting
This is the most important part of the lesson.
We are not just showing tracked boxes. We are extracting business-level events from a stream of detections.
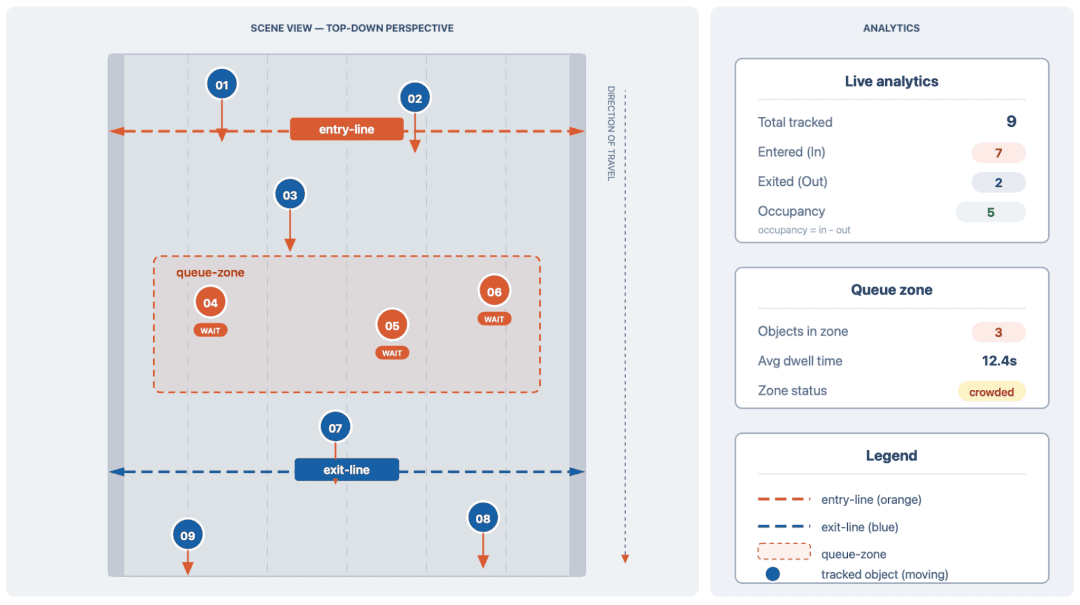
The main event in this lesson is line crossing, but the same analytics layer also supports class-filtered counting, multiple named lines, and optional zone occupancy, making it work as both a people counting system and a vehicle counting system.
The Idea
We define a virtual line across the frame. For each tracked object, we store its previous observed centroid and compare it with its current centroid.
If the centroid moves from one side of a configured line to the other, we count that as a crossing event.
The implementation is not limited to a single demo line. The analytics configuration can:
- Restrict counting to selected classes (e.g.,
personor a combination ofcar,bus, andtruck) - Handle multiple named counting lines in the same scene
- Track optional zone occupancy for a rectangular region of interest
Before going further, note the coordinate convention we are using. OpenCV frames follow the standard image coordinate system:
- the origin is at the top-left corner
xincreases to the rightyincreases downward
That convention affects both line direction and the sign of the crossing test. The "in" and "out" labels depend on the order of the line endpoints and the change in the centroid’s side-of-line value. Verify these labels against the intended direction of travel for your camera view.
This logic lives in video_analytics/analytics/engine.py:
@dataclass(slots=True)
class LineCrossingCounter:
    name: str
    line_start: Point
    line_end: Point
    allowed_classes: Optional[set[str]] = None
    previous_centroids: Dict[int, Point] = field(default_factory=dict)
    counted_track_ids: set[int] = field(default_factory=set)
    total_count: int = 0
    in_count: int = 0
    out_count: int = 0
The key state we store is:
- Previous centroid per track ID for each counting line
- Which track IDs have already been counted on each line
- Total, in, and out counters per line
- Optional occupancy count inside a configured zone
To determine whether a crossing happened, we compute which side of the line the object was on before and after:
previous_side = side_of_line(previous_centroid, self.line_start, self.line_end)
current_side = side_of_line(current_centroid, self.line_start, self.line_end)

if previous_side == 0:
    previous_side = current_side

if previous_side * current_side < 0:
    direction = "in" if previous_side < current_side else "out"
    self.counted_track_ids.add(track.track_id)
That is the heart of the line-crossing logic.
Once a track is counted, we add its ID to a counted_track_ids set so the same object is not counted repeatedly.
That design choice is deliberate. In this implementation, each track is counted only once per line. That works well for entry and exit counting use cases.
If your scene allows the same object to cross the same line multiple times, then you would want a more advanced per-track state machine instead of the simpler count-once logic used here.
The zone occupancy counter follows a simpler pattern. Instead of tracking crossings, it counts how many tracked objects currently have their centroid inside a rectangular region. In video_analytics/analytics/engine.py:
@dataclass(slots=True)
class ZoneOccupancyCounter:
    name: str
    top_left: Point
    bottom_right: Point
    allowed_classes: Optional[set[str]] = None
    occupancy_count: int = 0

    def update(self, tracks: List[Track]) -> None:
        current_count = 0
        for track in tracks:
            if self.allowed_classes is not None and track.class_name.lower() not in self.allowed_classes:
                continue

            centroid_x, centroid_y = track.centroid
            if self.top_left[0] <= centroid_x <= self.bottom_right[0] and self.top_left[1] <= centroid_y <= self.bottom_right[1]:
                current_count += 1
        self.occupancy_count = current_count

    def stats(self) -> Dict[str, int | str]:
        return {
            "name": self.name,
            "occupancy": self.occupancy_count,
        }
This is a per-frame snapshot, not cumulative. Every call to update recalculates the count from scratch based on which tracks are currently inside the zone. That makes it suitable for real-time occupancy monitoring where the question is “how many objects are in this region right now?”
Combined with class filters and optional zone occupancy, this is what makes the pipeline feel like a real application rather than a visualization demo.
OpenCV Visualization and Dashboard Overlay
Operators and developers both need a useful overlay.
The overlay should do more than draw boxes. It should answer the questions that matter during deployment and debugging.
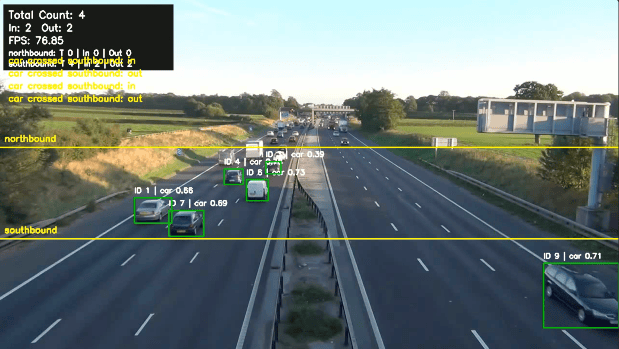
In video_analytics/rendering/visualization.py, you draw:
- bounding boxes
- track IDs
- class labels and confidence
- 1 or more virtual counting lines
- optional zone boundaries
- aggregate total count
- aggregate in and out count
- per-line totals
- optional zone occupancy
- FPS
One small implementation detail worth calling out: the overlay is designed to expose the system state, not just the detections. That is why the panel includes analytics results and runtime information instead of stopping at boxes and labels.
Here is the core track drawing function:
def draw_tracks(frame, tracks: Iterable[Track]) -> None:
    for track in tracks:
        x1, y1, x2, y2 = as_int_tuple(track.xyxy)
        cv2.rectangle(frame, (x1, y1), (x2, y2), BOX_COLOR, 2)
        label = f"ID {track.track_id} | {track.class_name} {track.confidence:.2f}"
        cv2.putText(frame, label, (x1, max(20, y1 - 10)), cv2.FONT_HERSHEY_SIMPLEX, 0.5, TEXT_COLOR, 2)
And the stats overlay:
def draw_stats(frame, stats: Dict[str, int], fps: float) -> None:
    lines = stats.get("lines", [])
    zone = stats.get("zone")
    panel_height = 90 + (len(lines) * 22) + (24 if zone else 0)
    cv2.rectangle(frame, (10, 10), (360, 10 + panel_height), PANEL_COLOR, -1)
    cv2.putText(frame, f"Total Count: {stats['total']}", (20, 38), cv2.FONT_HERSHEY_SIMPLEX, 0.7, TEXT_COLOR, 2)
    cv2.putText(frame, f"In: {stats['in']}  Out: {stats['out']}", (20, 64), cv2.FONT_HERSHEY_SIMPLEX, 0.65, TEXT_COLOR, 2)
    cv2.putText(frame, f"FPS: {fps:.2f}", (20, 90), cv2.FONT_HERSHEY_SIMPLEX, 0.65, TEXT_COLOR, 2)
In the current refactor, that panel can expand as the scene configuration gets richer. A simple run may show aggregate totals only, while a multi-line or zone-enabled run can also show per-line counts and occupancy. That makes the overlay useful both for demos and for validating system behavior during development.
The line drawing function is similarly straightforward:
def draw_line(frame, line_start: Point, line_end: Point, label: str | None = None) -> None:
    cv2.line(frame, line_start, line_end, LINE_COLOR, 2)
    if label:
        label_anchor = (line_start[0] + 12, max(24, line_start[1] - 12))
        cv2.putText(frame, label, label_anchor, cv2.FONT_HERSHEY_SIMPLEX, 0.6, LINE_COLOR, 2)
It takes 2 endpoints and an optional label, then draws a yellow line on the frame. The label is placed just above and to the right of the start point.
Zone drawing follows the same pattern:
def draw_zone(frame, top_left: Point, bottom_right: Point, label: str | None = None) -> None:
    cv2.rectangle(frame, top_left, bottom_right, (255, 180, 0), 2)
    if label:
        cv2.putText(frame, label, (top_left[0] + 8, max(24, top_left[1] - 10)),
                     cv2.FONT_HERSHEY_SIMPLEX, 0.6, (255, 180, 0), 2)
And the event log overlay shows the most recent line-crossing events so you can watch them happening in real time:
def draw_events(frame, events: Iterable[Tuple[str, str, str]]) -> None:
    y_offset = 130
    for class_name, line_name, direction in list(events)[-4:]:
        cv2.putText(frame, f"{class_name} crossed {line_name}: {direction}",
                     (20, y_offset), cv2.FONT_HERSHEY_SIMPLEX, 0.6, LINE_COLOR, 2)
        y_offset += 26
The [-4:] slice keeps only the 4 most recent events on screen so the overlay stays readable instead of growing endlessly.
Video I/O: The VideoStream and VideoWriter Classes
Before moving on to performance tuning, let us look at the video I/O layer that makes the pipeline work with both webcam feeds and recorded files.
The VideoStream class in video_analytics/io/video.py wraps OpenCV’s VideoCapture and handles frame reading, resizing, and optional frame skipping in one place:
class VideoStream:
    def __init__(self, config: VideoConfig) -> None:
        self.config = config
        self.capture = cv2.VideoCapture(parse_source(config.source))
        if not self.capture.isOpened():
            raise RuntimeError(f"Could not open video source: {config.source}")

    @property
    def fps(self) -> float:
        fps = self.capture.get(cv2.CAP_PROP_FPS)
        return fps if fps and fps > 0 else 30.0

    @property
    def frame_size(self) -> Tuple[int, int]:
        width = int(self.capture.get(cv2.CAP_PROP_FRAME_WIDTH))
        height = int(self.capture.get(cv2.CAP_PROP_FRAME_HEIGHT))
        if self.config.frame_width and width > 0:
            scale = self.config.frame_width / width
            return self.config.frame_width, int(height * scale)
        return width, height

    def frames(self) -> Generator[Tuple[int, any], None, None]:
        frame_index = 0
        while True:
            grabbed, frame = self.capture.read()
            if not grabbed:
                break
            if self.config.frame_skip and frame_index % (self.config.frame_skip + 1) != 0:
                frame_index += 1
                continue
            if self.config.frame_width:
                height, width = frame.shape[:2]
                scale = self.config.frame_width / float(width)
                frame = cv2.resize(frame, (self.config.frame_width, int(height * scale)))
            yield frame_index, frame
            frame_index += 1

    def release(self) -> None:
        self.capture.release()
A few details worth noting. The fps property falls back to 30.0 when the backend reports 0 or nothing. That happens more often than you would expect with webcams and some video containers. The frames() generator yields (frame_index, frame) tuples, which lets the pipeline track frame positions without maintaining a separate counter. Resizing and frame skipping are both handled inside this generator, so the rest of the pipeline always receives ready-to-process frames.
The companion VideoWriter class handles output recording:
class VideoWriter:
    def __init__(self, output_path: Optional[str], fps: float, frame_size: Tuple[int, int]) -> None:
        self.writer = None
        if output_path:
            fourcc = cv2.VideoWriter_fourcc(*"mp4v")
            self.writer = cv2.VideoWriter(output_path, fourcc, fps, frame_size)

    def write(self, frame) -> None:
        if self.writer is not None:
            self.writer.write(frame)

    def release(self) -> None:
        if self.writer is not None:
            self.writer.release()
If you pass --output output.mp4 on the command line, the pipeline records every rendered frame to disk. If you do not, the writer stays inactive and performs no video encoding or disk writes. That guard pattern keeps the code clean without needing separate “record” and “no-record” code paths.
Performance Optimization for Real-Time Object Detection
Real-time video analytics systems are rarely bottlenecked by a single operation. Their performance depends on how efficiently detection, tracking, analytics, and rendering work together.
This codebase uses 4 practical optimization techniques to balance throughput, latency, and detection quality. Rather than repeating the implementation details covered earlier, we will focus on how these techniques affect the overall pipeline.
It is also useful to think about latency as a pipeline rather than a single number:
End-to-end latency = detection + tracking + analytics + rendering
In most practical runs:
- Detection: often the most computationally expensive stage, particularly when running a deep learning model on every frame
- Tracking: generally lightweight compared with neural network inference, although its cost depends on the tracker and the number of tracked objects
- Analytics: typically adds little overhead when it consists of simple operations such as counting objects or updating statistics
- Rendering: a bottleneck when every frame must be annotated and displayed in real time
The goal is not simply to maximize detector throughput. It is to maintain an acceptable balance between processing speed, detection quality, and the responsiveness of the complete application.
Frame Resizing
We resize frames before inference to reduce compute cost and stabilize throughput.
That happens in video_analytics/io/video.py:
if self.config.frame_width:
    height, width = frame.shape[:2]
    scale = self.config.frame_width / float(width)
    frame = cv2.resize(frame, (self.config.frame_width, int(height * scale)))
FPS Calculation
We keep a rolling FPS estimate with FPSMeter in video_analytics/common/utils.py so the overlay reflects actual runtime performance.
In video_analytics/io/video.py, we also fall back to 30.0 FPS when the backend does not report a valid value. That is especially useful for webcams and inconsistent capture backends.
Optional Frame Skipping
If the incoming stream is heavier than the machine can handle in real time, frame skipping provides a simple way to trade temporal resolution for throughput.
That logic also lives in video_analytics/io/video.py:
if self.config.frame_skip and frame_index % (self.config.frame_skip + 1) != 0:
    frame_index += 1
    continue
CPU vs MPS
On macOS, the most useful deployment toggle is the device argument.
- Use
device cpufor stable central processing unit (CPU)-only baselines - Use
device mpson Apple Silicon when available
That makes the pipeline practical both for benchmarking and for day-to-day prototyping.
One more engineering note: the detector wrapper currently uses model.predict(...)[0] for clarity. For higher-throughput streaming systems, we can also explore streaming-oriented inference patterns (e.g., stream=True), but the current version is easier to teach and debug.

MPS delivers approximately 3.7 times the throughput of CPU execution under the tested settings. Timing each pipeline stage separately would establish how much of this improvement comes from model inference.
In practice, this means real-time performance is achievable on Apple Silicon with Metal Performance Shaders (MPS), while CPU-only execution may struggle to keep up with higher-resolution streams.
Running the Real-Time Video Analytics Pipeline
The runnable entry point starts in video_analytics/cli.py, while the frame-processing loop lives in video_analytics/pipeline.py. The root-level main.py remains as a thin convenience wrapper. This is the part where our OpenCV object tracking Python code comes together.
These modules do 4 things:
- Parse CLI arguments
- Build the pipeline configuration
- Instantiate the detector, tracker, analytics layer, and video stream
- Run the real-time frame loop
The command-line interface (CLI) itself is intentionally thin:
def main() -> None:
    args = parse_args()
    config = build_config(args)
    run_pipeline(config)
The heavier orchestration happens inside video_analytics/pipeline.py:
video_stream = VideoStream(config.video)
detector = YOLO26Detector(config.detection)
tracker = ByteTrackTracker(config.tracking, frame_rate=video_stream.fps)

frame_width, frame_height = video_stream.frame_size
analytics, resolved_lines = build_analytics_engine(config, frame_width, frame_height)
The build_analytics_engine function bridges our configuration and the live analytics objects. It resolves normalized line positions (e.g., line_y=0.5) into actual pixel coordinates using the frame dimensions, then creates 1 LineCrossingCounter per configured line and optionally a ZoneOccupancyCounter:
def build_analytics_engine(config, frame_width, frame_height):
    allowed_classes = set(config.analytics.class_allowlist) if config.analytics.class_allowlist else None
    resolved_lines = config.analytics.resolve_lines(frame_width, frame_height)
    line_counters = [
        LineCrossingCounter(
            name=line_name,
            line_start=line_points[0],
            line_end=line_points[1],
            allowed_classes=allowed_classes,
        )
        for line_name, line_points in resolved_lines
    ]

    zone_counter = None
    if config.analytics.zone is not None:
        zone_counter = ZoneOccupancyCounter(
            name=config.analytics.zone.name,
            top_left=config.analytics.zone.top_left,
            bottom_right=config.analytics.zone.bottom_right,
            allowed_classes=allowed_classes,
        )

    return AnalyticsEngine(line_counters=line_counters, zone_counter=zone_counter), resolved_lines
The result is an AnalyticsEngine that the frame loop can call with a simple analytics.update(tracks) on every iteration.
The actual frame loop ties everything together:
fps_meter = FPSMeter()
event_log: deque[tuple[str, str, str]] = deque(maxlen=4)
writer = VideoWriter(config.video.output_path, video_stream.fps, (frame_width, frame_height))

try:
    for _, frame in video_stream.frames():
        detections = detector.detect(frame)
        tracks = tracker.update(detections)
        events = analytics.update(tracks)
        for event in events:
            event_log.append((event.class_name, event.line_name, event.direction))

        fps = fps_meter.update()
        draw_tracks(frame, tracks)
        for line_name, line_points in resolved_lines:
            draw_line(frame, line_points[0], line_points[1], line_name)
        if config.analytics.zone is not None:
            draw_zone(frame, config.analytics.zone.top_left, config.analytics.zone.bottom_right, config.analytics.zone.name)
        draw_stats(frame, analytics.stats(), fps)
        draw_events(frame, event_log)

        writer.write(frame)

        if config.video.display:
            cv2.imshow("YOLO26 Video Analytics", frame)
            if cv2.waitKey(1) & 0xFF == ord("q"):
                break
finally:
    writer.release()
    video_stream.release()
    cv2.destroyAllWindows()
Each iteration reads 1 frame, pushes it through detection, tracking, and analytics, renders the overlay, and optionally writes to disk. The finally block ensures resources are cleaned up even if the loop exits early.
That split is useful because argument parsing, configuration, and runtime execution stay separate.
Here is the command to run it on a webcam:
cd yolo26_video_analytics
python main.py --source 0 --device mps --frame-width 960
If you want the pipeline configured specifically for people counting, use the preset:
cd yolo26_video_analytics
python main.py --preset people --source 0 --device mps
Those presets are defined in video_analytics/config.py. Here is what they look like:
def people_counting_preset() -> PipelineConfig:
    return PipelineConfig(
        detection=DetectionConfig(confidence=0.3),
        tracking=TrackingConfig(activation_threshold=0.3),
        video=VideoConfig(frame_width=960),
        analytics=AnalyticsConfig(
            lines=(AnalyticsLineConfig(name="entry-line", line_y=0.55),),
            class_allowlist=("person",),
        ),
    )


def traffic_counting_preset() -> PipelineConfig:
    return PipelineConfig(
        detection=DetectionConfig(confidence=0.35),
        tracking=TrackingConfig(activation_threshold=0.35),
        video=VideoConfig(frame_width=1280),
        analytics=AnalyticsConfig(
            lines=(
                AnalyticsLineConfig(name="northbound", line_y=0.42),
                AnalyticsLineConfig(name="southbound", line_y=0.68),
            ),
            class_allowlist=("car", "motorcycle", "bus", "truck"),
        ),
    )
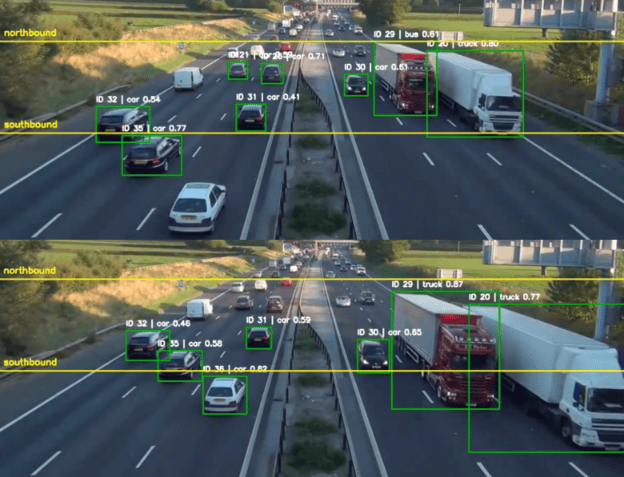
The people preset turns the pipeline into people counting software with a single counting line at 55% of the frame height, filtering for person only. The traffic preset turns it into a vehicle counting system with 2 named lines at 42% and 68%, restricted to vehicle classes. Both adjust confidence thresholds slightly higher than the default to reduce noise in their target scenarios.
And here is a file-based example:
cd yolo26_video_analytics
python main.py \
    --source assets/videos/traffic.mp4 \
    --preset traffic \
    --model assets/models/yolo26n.pt \
  --device cpu \
  --frame-width 1280 \
  --output runs/traffic_count.mp4
If you need more control, you can expose the line explicitly:
python main.py --source assets/videos/traffic.mp4 --line-points 100,320,1180,320
Or configure multiple named lines and a class filter:
python main.py \
    --source assets/videos/traffic.mp4 \
    --multi-line-points "entry:0,280,1280,280|exit:0,520,1280,520" \
    --class-filter person \
    --device mps
And if you want to monitor occupancy inside a region of interest:
python main.py \
    --preset people \
    --source assets/videos/traffic_clip.mp4 \
    --zone-points 300,180,980,680 \
    --device mps
Example Output (video demo)
When the system is running, we should see:
- stable bounding boxes
- stable track IDs
- 1 or more labeled counting lines depending on the configuration
- total, in, and out counts in the top-left
- per-line counts when multiple lines are enabled
- optional zone boundaries and occupancy if configured
- FPS updating live
That is the moment the system stops feeling like a model demo and starts feeling like an analytics application.
Real-World Applications of People Counting and Vehicle Counting Systems
This real-time video analytics pipeline structure is widely reusable.
Traffic Analytics
Count vehicles crossing a road segment or entering an intersection.
Use the traffic preset with --class-filter car,bus,truck,motorcycle to restrict counting to vehicle classes. With 2 named lines (e.g., northbound and southbound), you can measure crossings at 2 locations. Verify how each line’s "in" and "out" labels correspond to traffic direction. Detecting congestion requires additional analytics (e.g., speed or occupancy measurements).
Retail Analytics
Count customers entering or leaving a store zone.
Point a ceiling-mounted camera at the entrance, set a horizontal counting line at the doorway, and use --class-filter person. This implementation counts each track only once per line. If the same track enters and later exits across the same line, the return crossing is not counted. Use the zone occupancy counter to report the number of tracked people currently inside a configured region. Pair this with zone-based occupancy counting if we also want to know how many people are standing in a specific aisle or checkout area.
Surveillance and Security
Track movement across a perimeter or virtual gate.
Because ByteTrack assigns persistent IDs, we can log which tracks crossed a boundary and in which direction. The overlay displays the 4 most recent crossing events. To support later review, extend the pipeline to save events to a file or database.
Industrial Monitoring
Count items moving across a conveyor or crossing a checkpoint.
The same line-crossing logic that counts people and vehicles also works for packages, parts, or any other object the YOLO26 model can detect. We only need to adjust the class allowlist and line position to match the specific setup.
The important part is not the line itself. The important part is that once detection, tracking, and analytics are separated cleanly, we can swap the event logic for many other use cases.
What Can Go Wrong in Your Real-Time Video Analytics Pipeline
While building and running this pipeline, a few practical issues can show up:
- No output video generated: OpenCV does not create directories automatically. If we save to a path (e.g.,
runs/traffic_count.mp4), ensure theruns/folder already exists. - Low FPS or lag: Reduce the frame width, enable frame skipping, or switch between
cpuandmpsto find a better runtime balance. - Incorrect counts: Line placement matters. If the line is too close to the frame edge or objects only partially cross it, the counts may be inconsistent.
- Track ID switches: In crowded scenes or under occlusion, the tracker may reassign a new ID, which can lead to duplicate counts.
These are not signs that the code is fundamentally broken. They are normal challenges in real-world video analytics systems.
What's next? We recommend PyImageSearch University.

120+ total classes • 115+ hours of on-demand code walkthrough videos • Last updated: November 2026
★★★★★ 4.84 (128 Ratings) • 16,000+ Students Enrolled
I strongly believe that if you had the right teacher you could master computer vision and deep learning.
Do you think learning computer vision and deep learning has to be time-consuming, overwhelming, and complicated? Or has to involve complex mathematics and equations? Or requires a degree in computer science?
That’s not the case.
All you need to master computer vision and deep learning is for someone to explain things to you in simple, intuitive terms. And that’s exactly what I do. My mission is to change education and how complex Artificial Intelligence topics are taught.
If you're serious about learning computer vision, your next stop should be PyImageSearch University, the most comprehensive computer vision, deep learning, and OpenCV course online today. Here you’ll learn how to successfully and confidently apply computer vision to your work, research, and projects. Join me in computer vision mastery.
Inside PyImageSearch University you'll find:
- ✓ 120+ courses on essential computer vision, deep learning, and OpenCV topics
- ✓ 94+ Certificates of Completion
- ✓ 115+ hours of on-demand video
- ✓ Brand new courses released regularly, ensuring you can keep up with state-of-the-art techniques
- ✓ Pre-configured Jupyter Notebooks in Google Colab
- ✓ Run all code examples in your web browser — works on Windows, macOS, and Linux (no dev environment configuration required!)
- ✓ Access to centralized code repos for all 540+ tutorials on PyImageSearch
- ✓ Easy one-click downloads for code, datasets, pre-trained models, etc.
- ✓ Access on mobile, laptop, desktop, etc.
Summary
In this lesson, we moved beyond standalone object detection and built a complete real-time video analytics pipeline from scratch. Instead of thinking about one model in isolation, we learned to reason about a multi-stage system where detection, tracking, analytics, and visualization all need to work together cleanly.
We deployed YOLO26 as the detection backbone, wrapped ByteTrack for multi-object tracking, built a line-crossing analytics engine for people counting and vehicle counting, and connected everything through a modular pipeline that runs on both CPU and MPS. We used dataclasses to define clean interfaces between stages, and we kept configuration separate from runtime logic so the same codebase could serve a traffic counting preset, a people counting preset, or a fully custom setup.
The central idea of this lesson was the separation between detection and analytics. Detection alone can count objects within a frame, but counting unique objects or line-crossing events over time requires tracking and additional analytics. We need stable track IDs across frames before we can ask whether an object crossed a line or entered a zone. ByteTrack provided those IDs, and the analytics layer consumed them to produce directional counts, per-line totals, and optional zone occupancy.
Through the step-by-step build, we saw each layer added incrementally. We started with raw YOLO26 detections on video, added ByteTrack to get persistent IDs, layered in the LineCrossingCounter and ZoneOccupancyCounter for event-driven analytics, and finished with an OpenCV overlay that shows boxes, IDs, counts, and FPS in real time. We also explored practical performance controls including frame resizing, frame skipping, and the CPU vs MPS device toggle.
By the end of this lesson, we did not just detect objects in a video. We built a reusable pattern for real-time video analytics that separates concerns cleanly enough to swap the detector, change the tracker, or replace the analytics logic without rewriting the pipeline. That pattern applies equally well to traffic analytics, retail occupancy monitoring, security perimeter tracking, and industrial conveyor counting.
Citation Information
Singh, V. “Build a Real-Time Video Analytics Pipeline with YOLO26 and ByteTrack,” PyImageSearch, S. Huot, A. Sharma, and P. Thakur, eds., 2026, https://pyimg.co/koi0u
@incollection{Singh_2026_build-real-time-video-analytics-pipeline-yolo26-bytetrack,
  author = {Vikram Singh},
  title = {{Build a Real-Time Video Analytics Pipeline with YOLO26 and ByteTrack}},
  booktitle = {PyImageSearch},
  editor = {Susan Huot and Aditya Sharma and Piyush Thakur},
  year = {2026},
  url = {https://pyimg.co/koi0u},
}
To download the source code to this post (and be notified when future tutorials are published here on PyImageSearch), simply enter your email address in the form below!

Download the Source Code and FREE 17-page Resource Guide
Enter your email address below to get a .zip of the code and a FREE 17-page Resource Guide on Computer Vision, OpenCV, and Deep Learning. Inside you'll find my hand-picked tutorials, books, courses, and libraries to help you master CV and DL!


Comment section
Hey, Adrian Rosebrock here, author and creator of PyImageSearch. While I love hearing from readers, a couple years ago I made the tough decision to no longer offer 1:1 help over blog post comments.
At the time I was receiving 200+ emails per day and another 100+ blog post comments. I simply did not have the time to moderate and respond to them all, and the sheer volume of requests was taking a toll on me.
Instead, my goal is to do the most good for the computer vision, deep learning, and OpenCV community at large by focusing my time on authoring high-quality blog posts, tutorials, and books/courses.
If you need help learning computer vision and deep learning, I suggest you refer to my full catalog of books and courses — they have helped tens of thousands of developers, students, and researchers just like yourself learn Computer Vision, Deep Learning, and OpenCV.
Click here to browse my full catalog.